Ute vs Immigrants from Fiji Female Disability
COMPARE
Ute
Immigrants from Fiji
Female Disability
Female Disability Comparison
Ute
Immigrants from Fiji
12.4%
FEMALE DISABILITY
14.7/ 100
METRIC RATING
212th/ 347
METRIC RANK
12.3%
FEMALE DISABILITY
38.2/ 100
METRIC RATING
179th/ 347
METRIC RANK
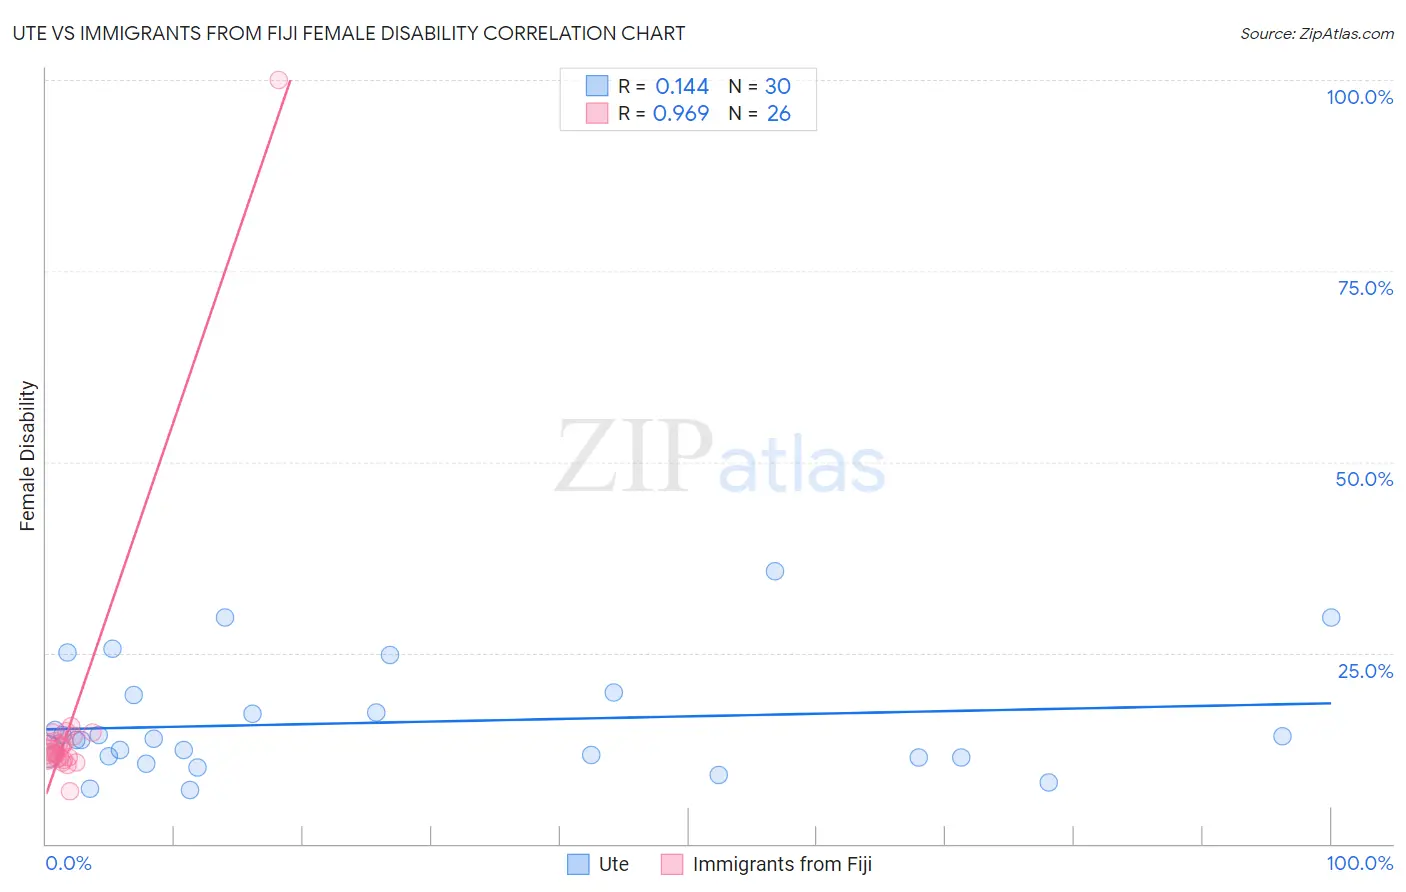
Ute vs Immigrants from Fiji Female Disability Correlation Chart
The statistical analysis conducted on geographies consisting of 55,657,679 people shows a poor positive correlation between the proportion of Ute and percentage of females with a disability in the United States with a correlation coefficient (R) of 0.144 and weighted average of 12.4%. Similarly, the statistical analysis conducted on geographies consisting of 93,754,243 people shows a perfect positive correlation between the proportion of Immigrants from Fiji and percentage of females with a disability in the United States with a correlation coefficient (R) of 0.969 and weighted average of 12.3%, a difference of 1.2%.
Female Disability Correlation Summary
| Measurement | Ute | Immigrants from Fiji |
| Minimum | 7.1% | 6.9% |
| Maximum | 35.7% | 100.0% |
| Range | 28.7% | 93.1% |
| Mean | 15.9% | 15.6% |
| Median | 13.7% | 12.0% |
| Interquartile 25% (IQ1) | 11.3% | 11.2% |
| Interquartile 75% (IQ3) | 19.5% | 13.4% |
| Interquartile Range (IQR) | 8.2% | 2.2% |
| Standard Deviation (Sample) | 7.3% | 17.3% |
| Standard Deviation (Population) | 7.1% | 17.0% |
Similar Demographics by Female Disability
Demographics Similar to Ute by Female Disability
In terms of female disability, the demographic groups most similar to Ute are Swiss (12.4%, a difference of 0.010%), Immigrants from Bosnia and Herzegovina (12.4%, a difference of 0.010%), Immigrants from Thailand (12.4%, a difference of 0.020%), Mexican (12.4%, a difference of 0.070%), and Panamanian (12.4%, a difference of 0.10%).
| Demographics | Rating | Rank | Female Disability |
| Immigrants | Grenada | 20.5 /100 | #205 | Fair 12.4% |
| Immigrants | Cuba | 20.2 /100 | #206 | Fair 12.4% |
| Croatians | 20.2 /100 | #207 | Fair 12.4% |
| Basques | 17.5 /100 | #208 | Poor 12.4% |
| Mexicans | 15.7 /100 | #209 | Poor 12.4% |
| Swiss | 14.9 /100 | #210 | Poor 12.4% |
| Immigrants | Bosnia and Herzegovina | 14.8 /100 | #211 | Poor 12.4% |
| Ute | 14.7 /100 | #212 | Poor 12.4% |
| Immigrants | Thailand | 14.5 /100 | #213 | Poor 12.4% |
| Panamanians | 13.5 /100 | #214 | Poor 12.4% |
| Samoans | 13.4 /100 | #215 | Poor 12.4% |
| Immigrants | Burma/Myanmar | 13.3 /100 | #216 | Poor 12.4% |
| British | 12.7 /100 | #217 | Poor 12.4% |
| Immigrants | Bahamas | 12.5 /100 | #218 | Poor 12.4% |
| Europeans | 12.1 /100 | #219 | Poor 12.4% |
Demographics Similar to Immigrants from Fiji by Female Disability
In terms of female disability, the demographic groups most similar to Immigrants from Fiji are Albanian (12.3%, a difference of 0.010%), Immigrants from Canada (12.3%, a difference of 0.040%), Norwegian (12.3%, a difference of 0.050%), Cuban (12.3%, a difference of 0.070%), and Iraqi (12.3%, a difference of 0.090%).
| Demographics | Rating | Rank | Female Disability |
| Haitians | 51.9 /100 | #172 | Average 12.2% |
| Immigrants | Mexico | 50.8 /100 | #173 | Average 12.2% |
| Immigrants | England | 50.0 /100 | #174 | Average 12.2% |
| Immigrants | St. Vincent and the Grenadines | 49.7 /100 | #175 | Average 12.2% |
| Immigrants | Guyana | 43.1 /100 | #176 | Average 12.2% |
| Immigrants | Ghana | 42.5 /100 | #177 | Average 12.2% |
| Immigrants | Western Europe | 40.9 /100 | #178 | Average 12.2% |
| Immigrants | Fiji | 38.2 /100 | #179 | Fair 12.3% |
| Albanians | 37.9 /100 | #180 | Fair 12.3% |
| Immigrants | Canada | 37.2 /100 | #181 | Fair 12.3% |
| Norwegians | 36.9 /100 | #182 | Fair 12.3% |
| Cubans | 36.5 /100 | #183 | Fair 12.3% |
| Iraqis | 36.0 /100 | #184 | Fair 12.3% |
| Immigrants | Uzbekistan | 33.9 /100 | #185 | Fair 12.3% |
| Austrians | 33.3 /100 | #186 | Fair 12.3% |