Immigrants from Syria vs Immigrants from Belarus Female Disability
COMPARE
Immigrants from Syria
Immigrants from Belarus
Female Disability
Female Disability Comparison
Immigrants from Syria
Immigrants from Belarus
11.9%
FEMALE DISABILITY
94.6/ 100
METRIC RATING
132nd/ 347
METRIC RANK
11.8%
FEMALE DISABILITY
97.8/ 100
METRIC RATING
113th/ 347
METRIC RANK
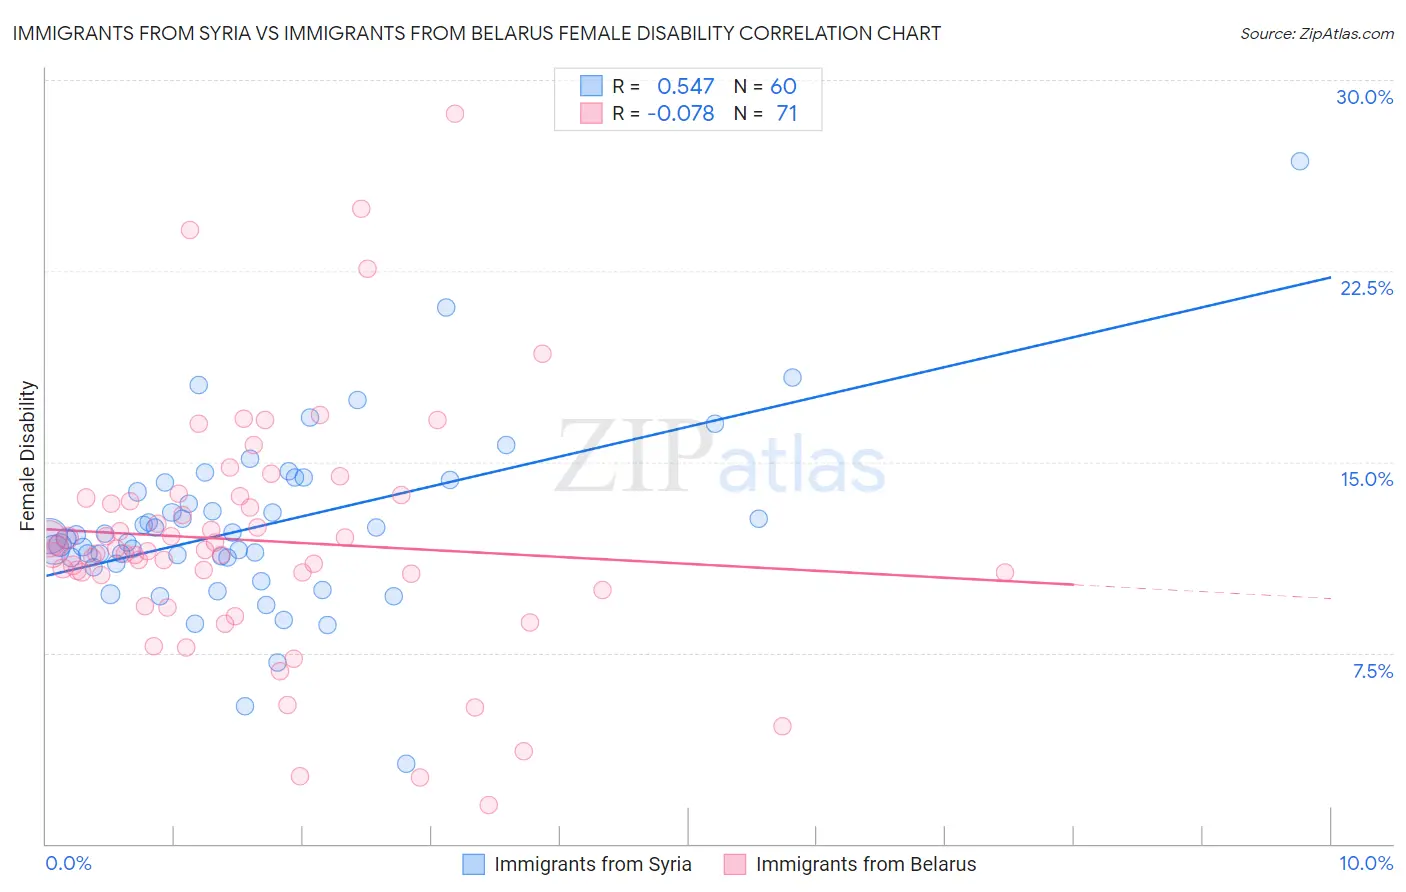
Immigrants from Syria vs Immigrants from Belarus Female Disability Correlation Chart
The statistical analysis conducted on geographies consisting of 174,112,013 people shows a substantial positive correlation between the proportion of Immigrants from Syria and percentage of females with a disability in the United States with a correlation coefficient (R) of 0.547 and weighted average of 11.9%. Similarly, the statistical analysis conducted on geographies consisting of 150,193,098 people shows a slight negative correlation between the proportion of Immigrants from Belarus and percentage of females with a disability in the United States with a correlation coefficient (R) of -0.078 and weighted average of 11.8%, a difference of 0.90%.
Female Disability Correlation Summary
| Measurement | Immigrants from Syria | Immigrants from Belarus |
| Minimum | 3.1% | 1.5% |
| Maximum | 26.8% | 28.7% |
| Range | 23.7% | 27.2% |
| Mean | 12.5% | 11.9% |
| Median | 12.0% | 11.5% |
| Interquartile 25% (IQ1) | 11.1% | 10.6% |
| Interquartile 75% (IQ3) | 14.0% | 13.6% |
| Interquartile Range (IQR) | 2.9% | 3.0% |
| Standard Deviation (Sample) | 3.5% | 4.7% |
| Standard Deviation (Population) | 3.5% | 4.7% |
Demographics Similar to Immigrants from Syria and Immigrants from Belarus by Female Disability
In terms of female disability, the demographic groups most similar to Immigrants from Syria are Arab (11.9%, a difference of 0.10%), Nicaraguan (11.9%, a difference of 0.12%), Macedonian (11.8%, a difference of 0.19%), Immigrants from Latvia (11.8%, a difference of 0.21%), and South American Indian (11.8%, a difference of 0.25%). Similarly, the demographic groups most similar to Immigrants from Belarus are Immigrants from Bangladesh (11.8%, a difference of 0.010%), South African (11.8%, a difference of 0.030%), Brazilian (11.8%, a difference of 0.030%), Immigrants from Morocco (11.8%, a difference of 0.070%), and Immigrants from Eastern Europe (11.8%, a difference of 0.23%).
| Demographics | Rating | Rank | Female Disability |
| Immigrants | Bangladesh | 97.8 /100 | #112 | Exceptional 11.8% |
| Immigrants | Belarus | 97.8 /100 | #113 | Exceptional 11.8% |
| South Africans | 97.7 /100 | #114 | Exceptional 11.8% |
| Brazilians | 97.7 /100 | #115 | Exceptional 11.8% |
| Immigrants | Morocco | 97.6 /100 | #116 | Exceptional 11.8% |
| Immigrants | Eastern Europe | 97.2 /100 | #117 | Exceptional 11.8% |
| Immigrants | Nigeria | 97.2 /100 | #118 | Exceptional 11.8% |
| Immigrants | Uganda | 97.2 /100 | #119 | Exceptional 11.8% |
| Immigrants | Kazakhstan | 97.0 /100 | #120 | Exceptional 11.8% |
| Immigrants | Netherlands | 96.9 /100 | #121 | Exceptional 11.8% |
| Immigrants | North Macedonia | 96.8 /100 | #122 | Exceptional 11.8% |
| Immigrants | Croatia | 96.7 /100 | #123 | Exceptional 11.8% |
| Russians | 96.5 /100 | #124 | Exceptional 11.8% |
| Immigrants | Italy | 96.4 /100 | #125 | Exceptional 11.8% |
| Immigrants | Europe | 96.2 /100 | #126 | Exceptional 11.8% |
| South American Indians | 95.8 /100 | #127 | Exceptional 11.8% |
| Immigrants | Latvia | 95.6 /100 | #128 | Exceptional 11.8% |
| Macedonians | 95.5 /100 | #129 | Exceptional 11.8% |
| Nicaraguans | 95.2 /100 | #130 | Exceptional 11.9% |
| Arabs | 95.1 /100 | #131 | Exceptional 11.9% |
| Immigrants | Syria | 94.6 /100 | #132 | Exceptional 11.9% |