Japanese vs Immigrants from Belarus Female Disability
COMPARE
Japanese
Immigrants from Belarus
Female Disability
Female Disability Comparison
Japanese
Immigrants from Belarus
12.6%
FEMALE DISABILITY
2.7/ 100
METRIC RATING
241st/ 347
METRIC RANK
11.8%
FEMALE DISABILITY
97.8/ 100
METRIC RATING
113th/ 347
METRIC RANK
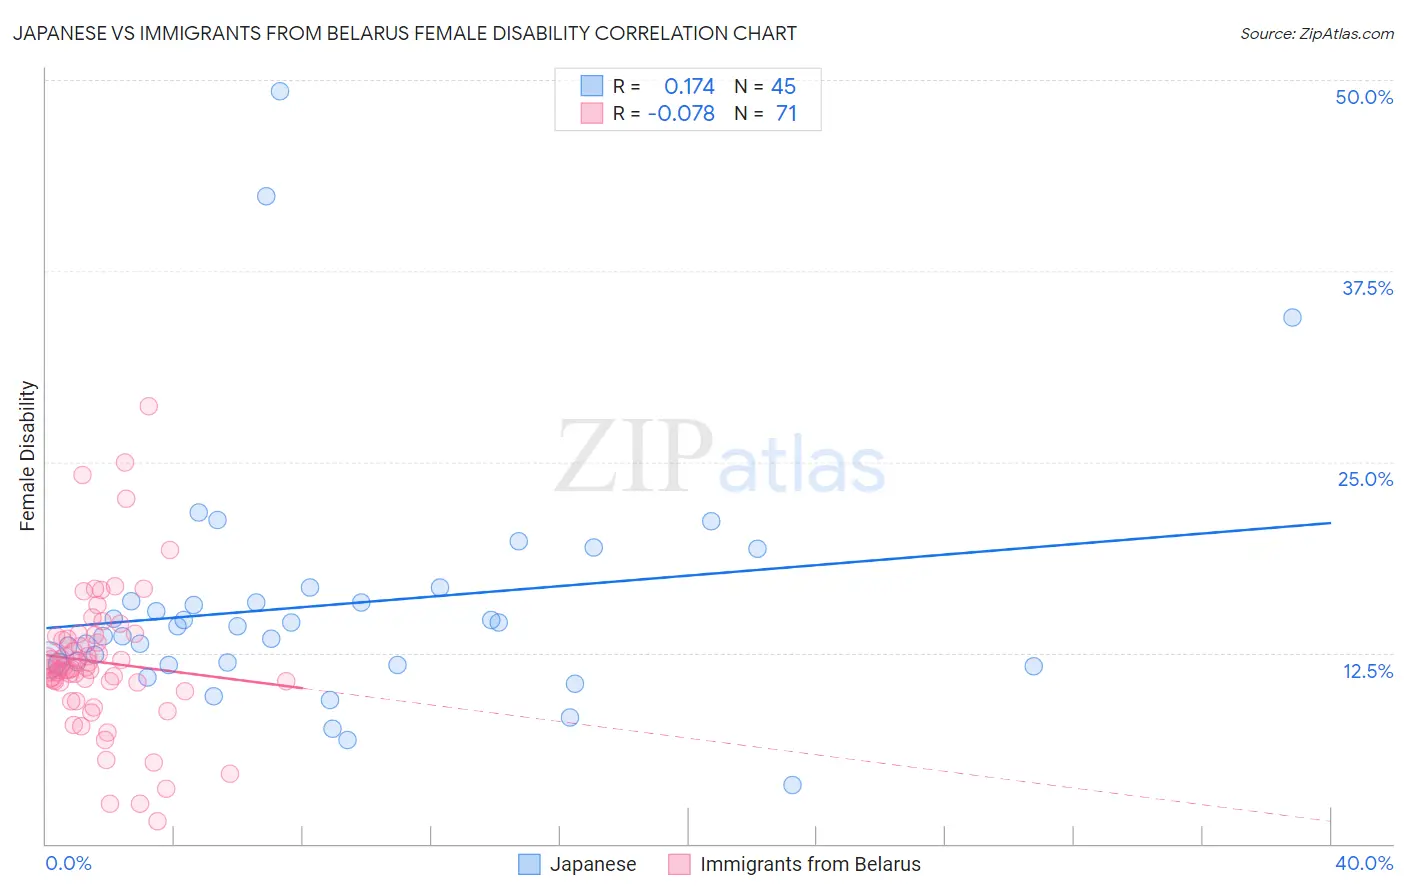
Japanese vs Immigrants from Belarus Female Disability Correlation Chart
The statistical analysis conducted on geographies consisting of 249,148,020 people shows a poor positive correlation between the proportion of Japanese and percentage of females with a disability in the United States with a correlation coefficient (R) of 0.174 and weighted average of 12.6%. Similarly, the statistical analysis conducted on geographies consisting of 150,193,098 people shows a slight negative correlation between the proportion of Immigrants from Belarus and percentage of females with a disability in the United States with a correlation coefficient (R) of -0.078 and weighted average of 11.8%, a difference of 7.2%.
Female Disability Correlation Summary
| Measurement | Japanese | Immigrants from Belarus |
| Minimum | 3.8% | 1.5% |
| Maximum | 49.3% | 28.7% |
| Range | 45.4% | 27.2% |
| Mean | 15.6% | 11.9% |
| Median | 14.2% | 11.5% |
| Interquartile 25% (IQ1) | 11.8% | 10.6% |
| Interquartile 75% (IQ3) | 16.3% | 13.6% |
| Interquartile Range (IQR) | 4.6% | 3.0% |
| Standard Deviation (Sample) | 8.2% | 4.7% |
| Standard Deviation (Population) | 8.1% | 4.7% |
Similar Demographics by Female Disability
Demographics Similar to Japanese by Female Disability
In terms of female disability, the demographic groups most similar to Japanese are Canadian (12.6%, a difference of 0.050%), Immigrants from Senegal (12.6%, a difference of 0.060%), Alsatian (12.6%, a difference of 0.070%), German Russian (12.6%, a difference of 0.17%), and Immigrants from Jamaica (12.6%, a difference of 0.21%).
| Demographics | Rating | Rank | Female Disability |
| Scandinavians | 5.3 /100 | #234 | Tragic 12.5% |
| Malaysians | 5.0 /100 | #235 | Tragic 12.5% |
| Immigrants | West Indies | 4.4 /100 | #236 | Tragic 12.6% |
| Slavs | 3.8 /100 | #237 | Tragic 12.6% |
| Yugoslavians | 3.7 /100 | #238 | Tragic 12.6% |
| Barbadians | 3.6 /100 | #239 | Tragic 12.6% |
| German Russians | 3.2 /100 | #240 | Tragic 12.6% |
| Japanese | 2.7 /100 | #241 | Tragic 12.6% |
| Canadians | 2.6 /100 | #242 | Tragic 12.6% |
| Immigrants | Senegal | 2.5 /100 | #243 | Tragic 12.6% |
| Alsatians | 2.5 /100 | #244 | Tragic 12.6% |
| Immigrants | Jamaica | 2.2 /100 | #245 | Tragic 12.6% |
| Spanish American Indians | 2.1 /100 | #246 | Tragic 12.6% |
| Menominee | 2.1 /100 | #247 | Tragic 12.6% |
| Carpatho Rusyns | 2.0 /100 | #248 | Tragic 12.6% |
Demographics Similar to Immigrants from Belarus by Female Disability
In terms of female disability, the demographic groups most similar to Immigrants from Belarus are Immigrants from Bangladesh (11.8%, a difference of 0.010%), South African (11.8%, a difference of 0.030%), Brazilian (11.8%, a difference of 0.030%), Immigrants from Morocco (11.8%, a difference of 0.070%), and Costa Rican (11.7%, a difference of 0.13%).
| Demographics | Rating | Rank | Female Disability |
| Immigrants | Greece | 98.2 /100 | #106 | Exceptional 11.7% |
| Latvians | 98.2 /100 | #107 | Exceptional 11.7% |
| New Zealanders | 98.1 /100 | #108 | Exceptional 11.7% |
| Immigrants | Immigrants | 98.1 /100 | #109 | Exceptional 11.7% |
| Soviet Union | 98.1 /100 | #110 | Exceptional 11.7% |
| Costa Ricans | 98.1 /100 | #111 | Exceptional 11.7% |
| Immigrants | Bangladesh | 97.8 /100 | #112 | Exceptional 11.8% |
| Immigrants | Belarus | 97.8 /100 | #113 | Exceptional 11.8% |
| South Africans | 97.7 /100 | #114 | Exceptional 11.8% |
| Brazilians | 97.7 /100 | #115 | Exceptional 11.8% |
| Immigrants | Morocco | 97.6 /100 | #116 | Exceptional 11.8% |
| Immigrants | Eastern Europe | 97.2 /100 | #117 | Exceptional 11.8% |
| Immigrants | Nigeria | 97.2 /100 | #118 | Exceptional 11.8% |
| Immigrants | Uganda | 97.2 /100 | #119 | Exceptional 11.8% |
| Immigrants | Kazakhstan | 97.0 /100 | #120 | Exceptional 11.8% |