Swiss vs Immigrants from Egypt Currently Married
COMPARE
Swiss
Immigrants from Egypt
Currently Married
Currently Married Comparison
Swiss
Immigrants from Egypt
49.7%
CURRENTLY MARRIED
99.9/ 100
METRIC RATING
12th/ 347
METRIC RANK
47.7%
CURRENTLY MARRIED
92.3/ 100
METRIC RATING
109th/ 347
METRIC RANK
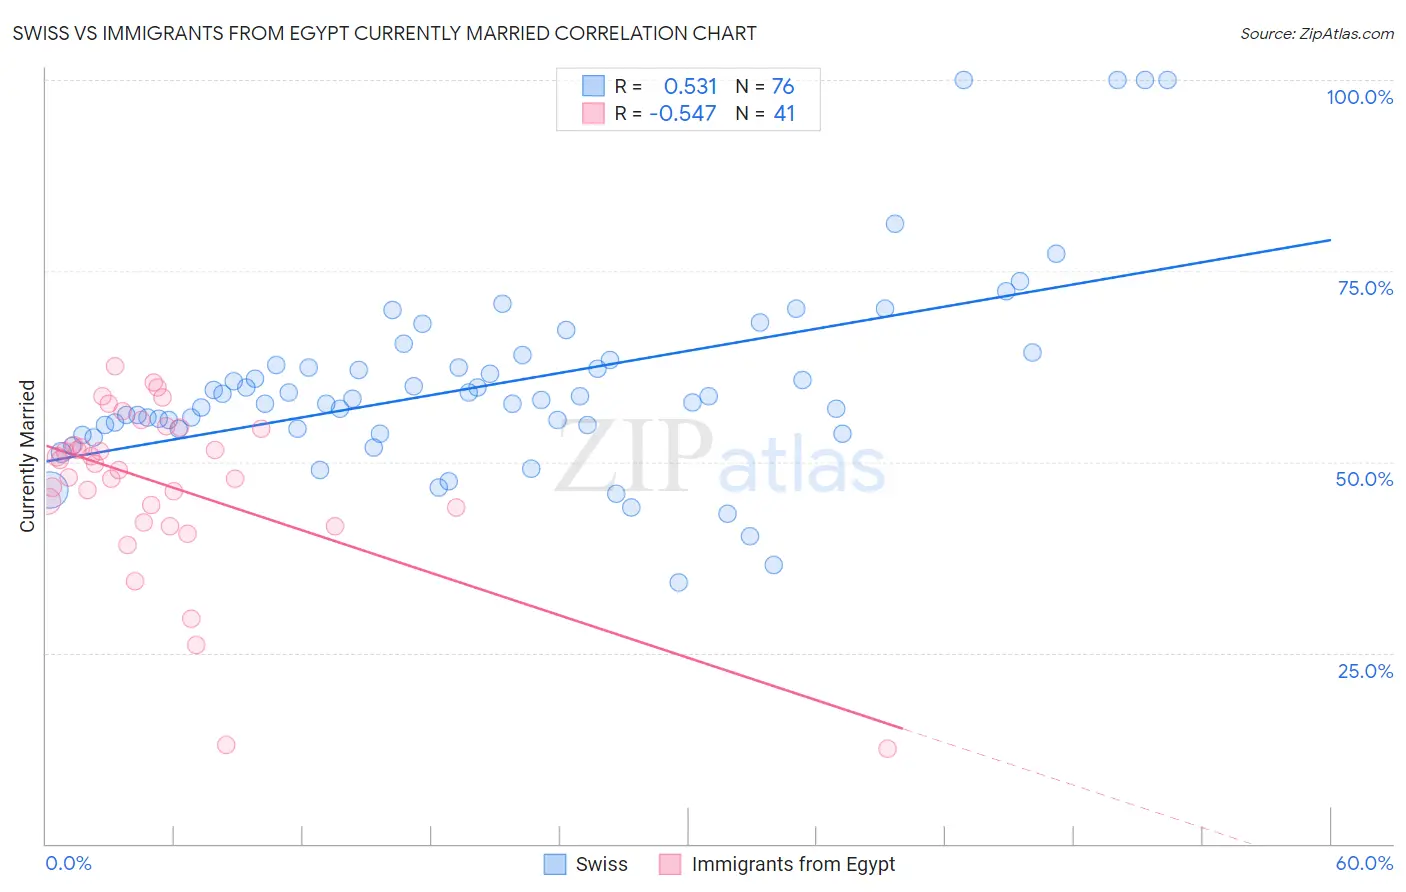
Swiss vs Immigrants from Egypt Currently Married Correlation Chart
The statistical analysis conducted on geographies consisting of 464,962,808 people shows a substantial positive correlation between the proportion of Swiss and percentage of population currently married in the United States with a correlation coefficient (R) of 0.531 and weighted average of 49.7%. Similarly, the statistical analysis conducted on geographies consisting of 245,480,617 people shows a substantial negative correlation between the proportion of Immigrants from Egypt and percentage of population currently married in the United States with a correlation coefficient (R) of -0.547 and weighted average of 47.7%, a difference of 4.3%.
Currently Married Correlation Summary
| Measurement | Swiss | Immigrants from Egypt |
| Minimum | 34.3% | 12.5% |
| Maximum | 100.0% | 62.5% |
| Range | 65.7% | 50.0% |
| Mean | 60.1% | 47.1% |
| Median | 58.2% | 49.7% |
| Interquartile 25% (IQ1) | 54.3% | 43.1% |
| Interquartile 75% (IQ3) | 63.1% | 54.5% |
| Interquartile Range (IQR) | 8.8% | 11.4% |
| Standard Deviation (Sample) | 12.7% | 11.1% |
| Standard Deviation (Population) | 12.6% | 11.0% |
Similar Demographics by Currently Married
Demographics Similar to Swiss by Currently Married
In terms of currently married, the demographic groups most similar to Swiss are English (49.7%, a difference of 0.0%), Filipino (49.7%, a difference of 0.020%), Dutch (49.6%, a difference of 0.26%), Czech (49.9%, a difference of 0.27%), and German (49.6%, a difference of 0.28%).
| Demographics | Rating | Rank | Currently Married |
| Danes | 100.0 /100 | #5 | Exceptional 50.5% |
| Norwegians | 100.0 /100 | #6 | Exceptional 50.2% |
| Immigrants | South Central Asia | 100.0 /100 | #7 | Exceptional 50.0% |
| Swedes | 100.0 /100 | #8 | Exceptional 50.0% |
| Czechs | 99.9 /100 | #9 | Exceptional 49.9% |
| Filipinos | 99.9 /100 | #10 | Exceptional 49.7% |
| English | 99.9 /100 | #11 | Exceptional 49.7% |
| Swiss | 99.9 /100 | #12 | Exceptional 49.7% |
| Dutch | 99.9 /100 | #13 | Exceptional 49.6% |
| Germans | 99.9 /100 | #14 | Exceptional 49.6% |
| Pennsylvania Germans | 99.9 /100 | #15 | Exceptional 49.6% |
| Chinese | 99.9 /100 | #16 | Exceptional 49.5% |
| Scandinavians | 99.9 /100 | #17 | Exceptional 49.5% |
| Immigrants | Scotland | 99.8 /100 | #18 | Exceptional 49.3% |
| Europeans | 99.8 /100 | #19 | Exceptional 49.3% |
Demographics Similar to Immigrants from Egypt by Currently Married
In terms of currently married, the demographic groups most similar to Immigrants from Egypt are Tsimshian (47.7%, a difference of 0.010%), Immigrants from Russia (47.7%, a difference of 0.040%), Immigrants from Italy (47.7%, a difference of 0.080%), Immigrants from Greece (47.7%, a difference of 0.11%), and Immigrants from Hungary (47.6%, a difference of 0.13%).
| Demographics | Rating | Rank | Currently Married |
| Turks | 93.9 /100 | #102 | Exceptional 47.8% |
| Cypriots | 93.7 /100 | #103 | Exceptional 47.8% |
| Serbians | 93.6 /100 | #104 | Exceptional 47.8% |
| Immigrants | Singapore | 93.3 /100 | #105 | Exceptional 47.8% |
| Immigrants | Greece | 93.1 /100 | #106 | Exceptional 47.7% |
| Immigrants | Italy | 92.9 /100 | #107 | Exceptional 47.7% |
| Tsimshian | 92.4 /100 | #108 | Exceptional 47.7% |
| Immigrants | Egypt | 92.3 /100 | #109 | Exceptional 47.7% |
| Immigrants | Russia | 92.0 /100 | #110 | Exceptional 47.7% |
| Immigrants | Hungary | 91.2 /100 | #111 | Exceptional 47.6% |
| Immigrants | Western Europe | 91.1 /100 | #112 | Exceptional 47.6% |
| Immigrants | Denmark | 90.9 /100 | #113 | Exceptional 47.6% |
| South Africans | 90.5 /100 | #114 | Exceptional 47.6% |
| Immigrants | Indonesia | 90.5 /100 | #115 | Exceptional 47.6% |
| Palestinians | 90.4 /100 | #116 | Exceptional 47.6% |