Immigrants from Latvia vs Immigrants from Cameroon Hearing Disability
COMPARE
Immigrants from Latvia
Immigrants from Cameroon
Hearing Disability
Hearing Disability Comparison
Immigrants from Latvia
Immigrants from Cameroon
3.1%
HEARING DISABILITY
12.7/ 100
METRIC RATING
208th/ 347
METRIC RANK
2.6%
HEARING DISABILITY
99.7/ 100
METRIC RATING
31st/ 347
METRIC RANK
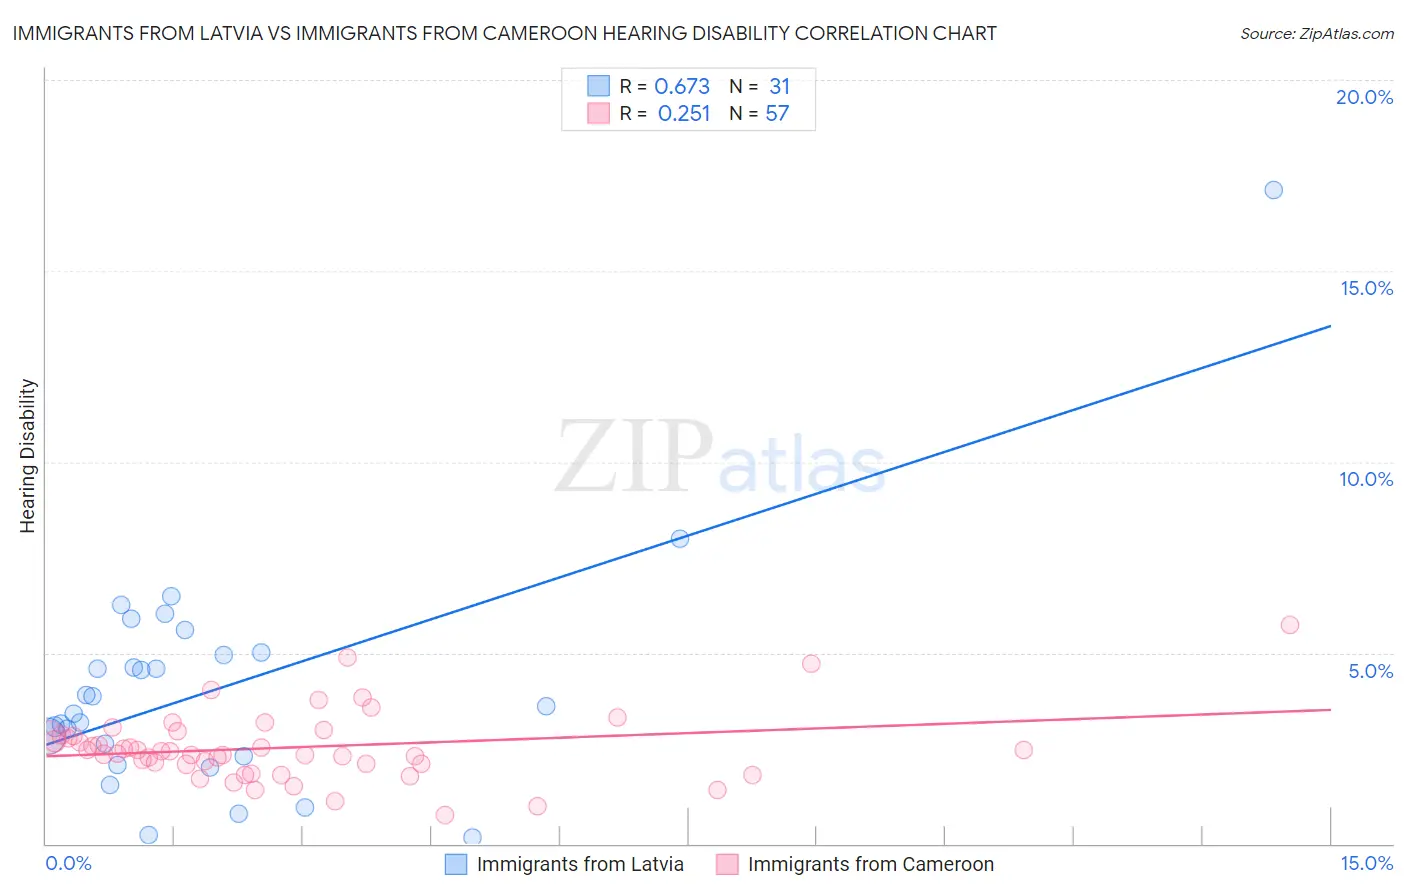
Immigrants from Latvia vs Immigrants from Cameroon Hearing Disability Correlation Chart
The statistical analysis conducted on geographies consisting of 113,736,493 people shows a significant positive correlation between the proportion of Immigrants from Latvia and percentage of population with hearing disability in the United States with a correlation coefficient (R) of 0.673 and weighted average of 3.1%. Similarly, the statistical analysis conducted on geographies consisting of 130,730,708 people shows a weak positive correlation between the proportion of Immigrants from Cameroon and percentage of population with hearing disability in the United States with a correlation coefficient (R) of 0.251 and weighted average of 2.6%, a difference of 20.7%.
Hearing Disability Correlation Summary
| Measurement | Immigrants from Latvia | Immigrants from Cameroon |
| Minimum | 0.16% | 0.75% |
| Maximum | 17.1% | 5.7% |
| Range | 17.0% | 5.0% |
| Mean | 4.1% | 2.5% |
| Median | 3.6% | 2.4% |
| Interquartile 25% (IQ1) | 2.3% | 2.1% |
| Interquartile 75% (IQ3) | 5.0% | 2.8% |
| Interquartile Range (IQR) | 2.7% | 0.75% |
| Standard Deviation (Sample) | 3.1% | 0.91% |
| Standard Deviation (Population) | 3.0% | 0.90% |
Similar Demographics by Hearing Disability
Demographics Similar to Immigrants from Latvia by Hearing Disability
In terms of hearing disability, the demographic groups most similar to Immigrants from Latvia are Immigrants from Hungary (3.1%, a difference of 0.040%), Cape Verdean (3.1%, a difference of 0.090%), Romanian (3.1%, a difference of 0.13%), Pakistani (3.1%, a difference of 0.33%), and Hispanic or Latino (3.1%, a difference of 0.46%).
| Demographics | Rating | Rank | Hearing Disability |
| Iraqis | 19.0 /100 | #201 | Poor 3.1% |
| Immigrants | Thailand | 16.4 /100 | #202 | Poor 3.1% |
| Immigrants | Denmark | 16.2 /100 | #203 | Poor 3.1% |
| Immigrants | Czechoslovakia | 15.9 /100 | #204 | Poor 3.1% |
| Alsatians | 15.9 /100 | #205 | Poor 3.1% |
| Eastern Europeans | 15.5 /100 | #206 | Poor 3.1% |
| Hispanics or Latinos | 15.1 /100 | #207 | Poor 3.1% |
| Immigrants | Latvia | 12.7 /100 | #208 | Poor 3.1% |
| Immigrants | Hungary | 12.5 /100 | #209 | Poor 3.1% |
| Cape Verdeans | 12.2 /100 | #210 | Poor 3.1% |
| Romanians | 12.1 /100 | #211 | Poor 3.1% |
| Pakistanis | 11.1 /100 | #212 | Poor 3.1% |
| Immigrants | Iraq | 10.5 /100 | #213 | Poor 3.1% |
| Australians | 8.1 /100 | #214 | Tragic 3.2% |
| Bangladeshis | 8.1 /100 | #215 | Tragic 3.2% |
Demographics Similar to Immigrants from Cameroon by Hearing Disability
In terms of hearing disability, the demographic groups most similar to Immigrants from Cameroon are Immigrants from Caribbean (2.6%, a difference of 0.010%), Bolivian (2.6%, a difference of 0.090%), Immigrants from Haiti (2.6%, a difference of 0.11%), Immigrants from Venezuela (2.6%, a difference of 0.14%), and Filipino (2.6%, a difference of 0.40%).
| Demographics | Rating | Rank | Hearing Disability |
| Immigrants | Ghana | 99.8 /100 | #24 | Exceptional 2.6% |
| Immigrants | El Salvador | 99.7 /100 | #25 | Exceptional 2.6% |
| Immigrants | Senegal | 99.7 /100 | #26 | Exceptional 2.6% |
| Immigrants | South Central Asia | 99.7 /100 | #27 | Exceptional 2.6% |
| Immigrants | Haiti | 99.7 /100 | #28 | Exceptional 2.6% |
| Bolivians | 99.7 /100 | #29 | Exceptional 2.6% |
| Immigrants | Caribbean | 99.7 /100 | #30 | Exceptional 2.6% |
| Immigrants | Cameroon | 99.7 /100 | #31 | Exceptional 2.6% |
| Immigrants | Venezuela | 99.7 /100 | #32 | Exceptional 2.6% |
| Filipinos | 99.6 /100 | #33 | Exceptional 2.6% |
| Immigrants | Pakistan | 99.6 /100 | #34 | Exceptional 2.6% |
| Salvadorans | 99.6 /100 | #35 | Exceptional 2.6% |
| Okinawans | 99.6 /100 | #36 | Exceptional 2.6% |
| Immigrants | Western Africa | 99.6 /100 | #37 | Exceptional 2.6% |
| Immigrants | Jamaica | 99.5 /100 | #38 | Exceptional 2.6% |