Swiss vs Immigrants from Cameroon Median Female Earnings
COMPARE
Swiss
Immigrants from Cameroon
Median Female Earnings
Median Female Earnings Comparison
Swiss
Immigrants from Cameroon
$37,904
MEDIAN FEMALE EARNINGS
2.3/ 100
METRIC RATING
249th/ 347
METRIC RANK
$40,354
MEDIAN FEMALE EARNINGS
79.7/ 100
METRIC RATING
149th/ 347
METRIC RANK
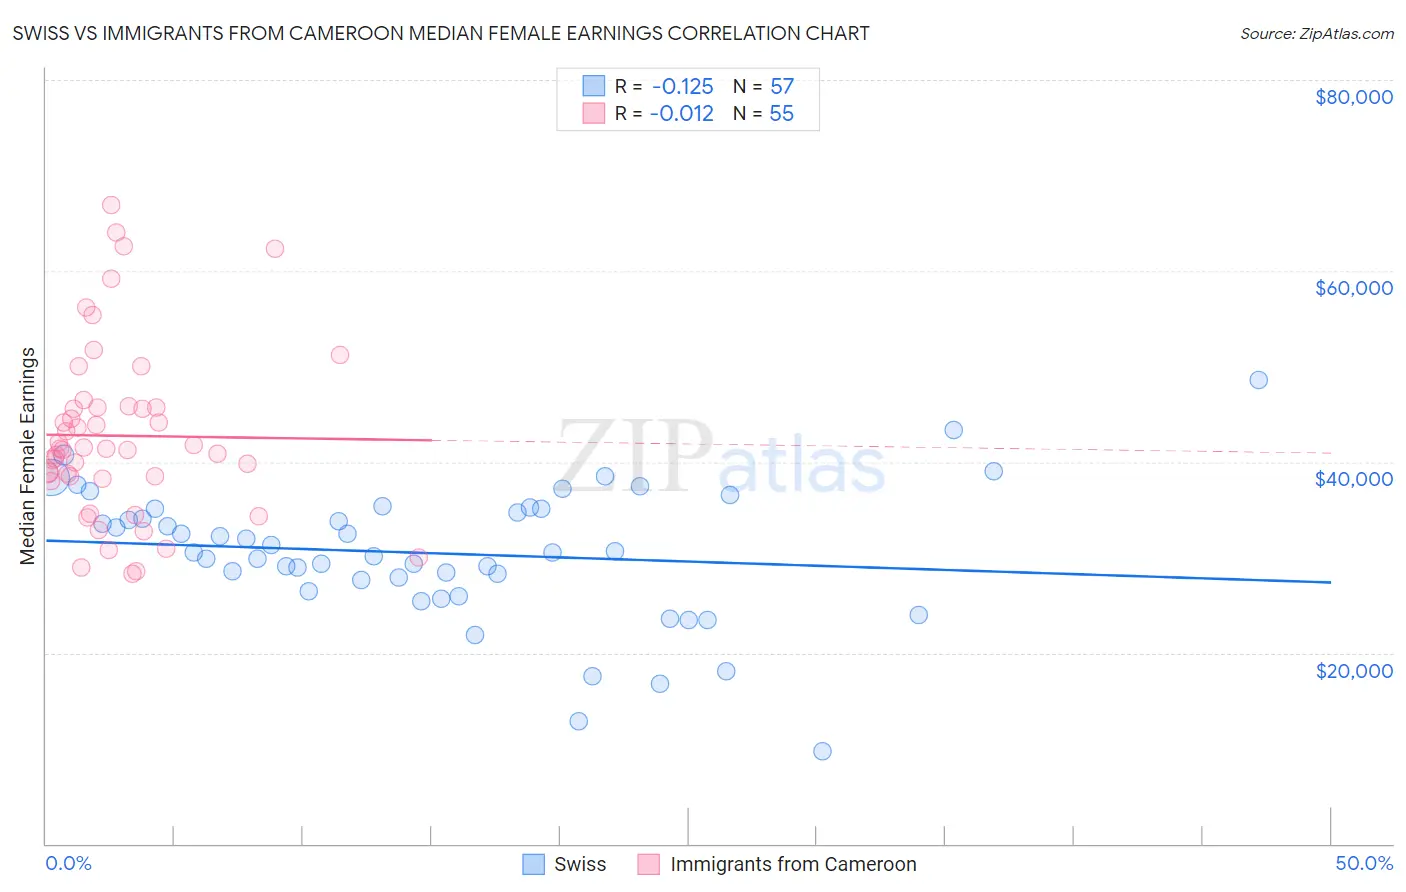
Swiss vs Immigrants from Cameroon Median Female Earnings Correlation Chart
The statistical analysis conducted on geographies consisting of 464,484,716 people shows a poor negative correlation between the proportion of Swiss and median female earnings in the United States with a correlation coefficient (R) of -0.125 and weighted average of $37,904. Similarly, the statistical analysis conducted on geographies consisting of 130,684,247 people shows no correlation between the proportion of Immigrants from Cameroon and median female earnings in the United States with a correlation coefficient (R) of -0.012 and weighted average of $40,354, a difference of 6.5%.
Median Female Earnings Correlation Summary
| Measurement | Swiss | Immigrants from Cameroon |
| Minimum | $9,649 | $28,227 |
| Maximum | $48,533 | $66,884 |
| Range | $38,884 | $38,657 |
| Mean | $30,422 | $42,735 |
| Median | $30,468 | $41,397 |
| Interquartile 25% (IQ1) | $27,075 | $38,192 |
| Interquartile 75% (IQ3) | $35,111 | $45,723 |
| Interquartile Range (IQR) | $8,036 | $7,531 |
| Standard Deviation (Sample) | $7,120 | $9,076 |
| Standard Deviation (Population) | $7,057 | $8,993 |
Similar Demographics by Median Female Earnings
Demographics Similar to Swiss by Median Female Earnings
In terms of median female earnings, the demographic groups most similar to Swiss are Alaskan Athabascan ($37,905, a difference of 0.0%), Immigrants from Somalia ($37,914, a difference of 0.030%), Immigrants from Iraq ($37,864, a difference of 0.11%), Welsh ($37,856, a difference of 0.13%), and Immigrants from Middle Africa ($37,965, a difference of 0.16%).
| Demographics | Rating | Rank | Median Female Earnings |
| Immigrants | Burma/Myanmar | 3.0 /100 | #242 | Tragic $38,028 |
| Germans | 2.8 /100 | #243 | Tragic $37,986 |
| Immigrants | Liberia | 2.7 /100 | #244 | Tragic $37,970 |
| Immigrants | Middle Africa | 2.7 /100 | #245 | Tragic $37,965 |
| Delaware | 2.6 /100 | #246 | Tragic $37,964 |
| Immigrants | Somalia | 2.4 /100 | #247 | Tragic $37,914 |
| Alaskan Athabascans | 2.3 /100 | #248 | Tragic $37,905 |
| Swiss | 2.3 /100 | #249 | Tragic $37,904 |
| Immigrants | Iraq | 2.2 /100 | #250 | Tragic $37,864 |
| Welsh | 2.1 /100 | #251 | Tragic $37,856 |
| Immigrants | Dominica | 2.0 /100 | #252 | Tragic $37,825 |
| Danes | 1.6 /100 | #253 | Tragic $37,730 |
| Whites/Caucasians | 1.1 /100 | #254 | Tragic $37,531 |
| Colville | 1.1 /100 | #255 | Tragic $37,514 |
| Samoans | 1.0 /100 | #256 | Tragic $37,498 |
Demographics Similar to Immigrants from Cameroon by Median Female Earnings
In terms of median female earnings, the demographic groups most similar to Immigrants from Cameroon are Immigrants from Chile ($40,353, a difference of 0.0%), Immigrants from Armenia ($40,340, a difference of 0.030%), Polish ($40,371, a difference of 0.040%), Vietnamese ($40,377, a difference of 0.060%), and West Indian ($40,317, a difference of 0.090%).
| Demographics | Rating | Rank | Median Female Earnings |
| Sri Lankans | 84.0 /100 | #142 | Excellent $40,496 |
| Northern Europeans | 83.9 /100 | #143 | Excellent $40,491 |
| Immigrants | North Macedonia | 83.8 /100 | #144 | Excellent $40,488 |
| Brazilians | 83.6 /100 | #145 | Excellent $40,483 |
| Ghanaians | 82.1 /100 | #146 | Excellent $40,429 |
| Vietnamese | 80.4 /100 | #147 | Excellent $40,377 |
| Poles | 80.2 /100 | #148 | Excellent $40,371 |
| Immigrants | Cameroon | 79.7 /100 | #149 | Good $40,354 |
| Immigrants | Chile | 79.6 /100 | #150 | Good $40,353 |
| Immigrants | Armenia | 79.2 /100 | #151 | Good $40,340 |
| West Indians | 78.4 /100 | #152 | Good $40,317 |
| British West Indians | 77.7 /100 | #153 | Good $40,299 |
| Immigrants | Oceania | 77.6 /100 | #154 | Good $40,297 |
| Immigrants | Africa | 76.2 /100 | #155 | Good $40,257 |
| Peruvians | 75.3 /100 | #156 | Good $40,234 |