Dutch vs Immigrants from Cameroon Hearing Disability
COMPARE
Dutch
Immigrants from Cameroon
Hearing Disability
Hearing Disability Comparison
Dutch
Immigrants from Cameroon
3.7%
HEARING DISABILITY
0.0/ 100
METRIC RATING
302nd/ 347
METRIC RANK
2.6%
HEARING DISABILITY
99.7/ 100
METRIC RATING
31st/ 347
METRIC RANK
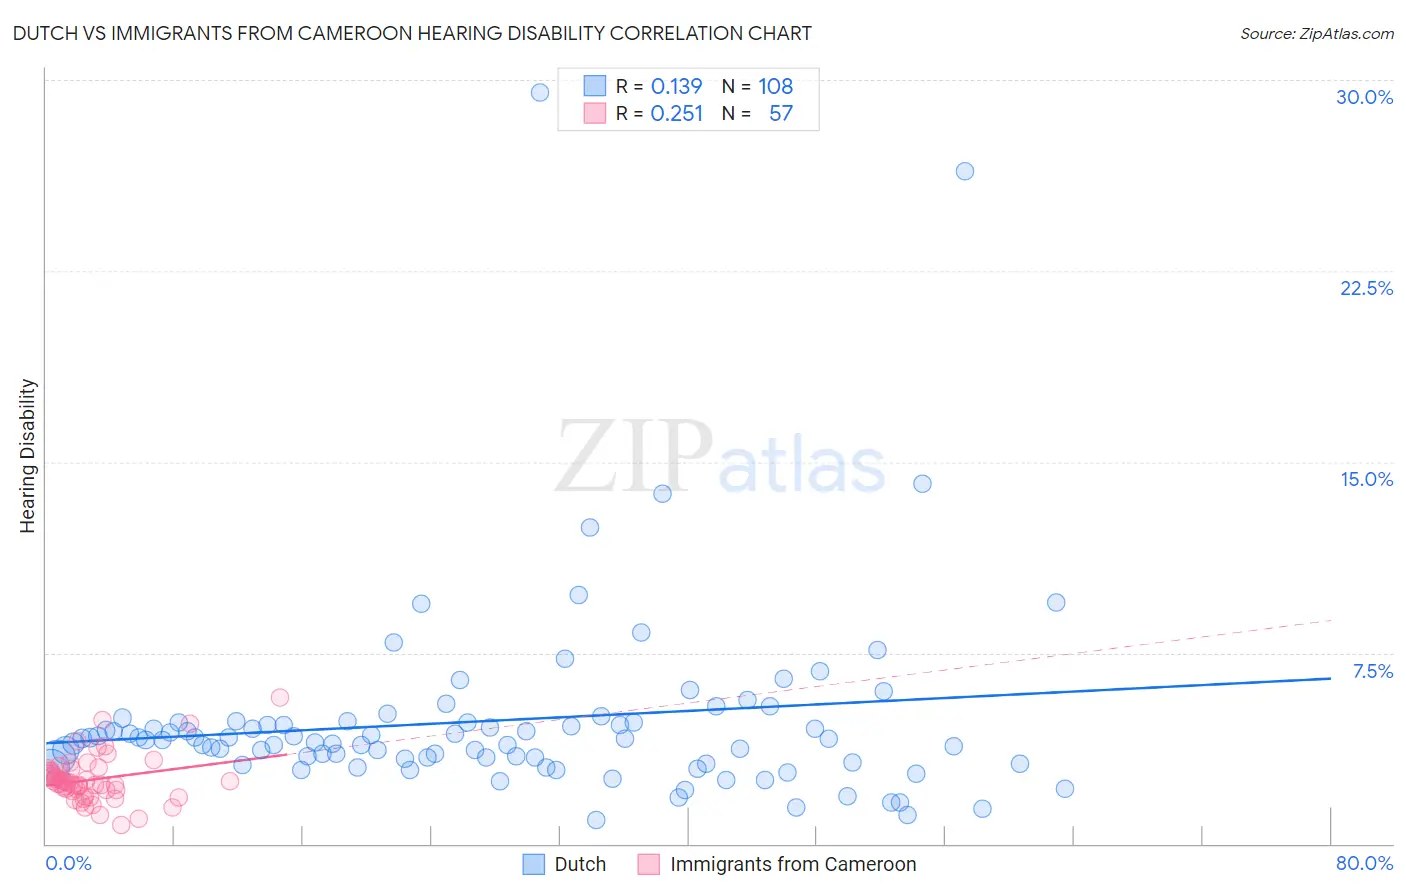
Dutch vs Immigrants from Cameroon Hearing Disability Correlation Chart
The statistical analysis conducted on geographies consisting of 553,868,421 people shows a poor positive correlation between the proportion of Dutch and percentage of population with hearing disability in the United States with a correlation coefficient (R) of 0.139 and weighted average of 3.7%. Similarly, the statistical analysis conducted on geographies consisting of 130,730,708 people shows a weak positive correlation between the proportion of Immigrants from Cameroon and percentage of population with hearing disability in the United States with a correlation coefficient (R) of 0.251 and weighted average of 2.6%, a difference of 44.2%.
Hearing Disability Correlation Summary
| Measurement | Dutch | Immigrants from Cameroon |
| Minimum | 0.93% | 0.75% |
| Maximum | 29.5% | 5.7% |
| Range | 28.6% | 5.0% |
| Mean | 4.8% | 2.5% |
| Median | 4.1% | 2.4% |
| Interquartile 25% (IQ1) | 3.3% | 2.1% |
| Interquartile 75% (IQ3) | 4.8% | 2.8% |
| Interquartile Range (IQR) | 1.5% | 0.75% |
| Standard Deviation (Sample) | 3.9% | 0.91% |
| Standard Deviation (Population) | 3.9% | 0.90% |
Similar Demographics by Hearing Disability
Demographics Similar to Dutch by Hearing Disability
In terms of hearing disability, the demographic groups most similar to Dutch are Menominee (3.7%, a difference of 0.060%), Pennsylvania German (3.7%, a difference of 0.11%), Scottish (3.7%, a difference of 0.13%), German (3.7%, a difference of 0.20%), and French (3.8%, a difference of 0.36%).
| Demographics | Rating | Rank | Hearing Disability |
| Welsh | 0.0 /100 | #295 | Tragic 3.7% |
| Pima | 0.0 /100 | #296 | Tragic 3.7% |
| Immigrants | Azores | 0.0 /100 | #297 | Tragic 3.7% |
| Celtics | 0.0 /100 | #298 | Tragic 3.7% |
| Germans | 0.0 /100 | #299 | Tragic 3.7% |
| Scottish | 0.0 /100 | #300 | Tragic 3.7% |
| Pennsylvania Germans | 0.0 /100 | #301 | Tragic 3.7% |
| Dutch | 0.0 /100 | #302 | Tragic 3.7% |
| Menominee | 0.0 /100 | #303 | Tragic 3.7% |
| French | 0.0 /100 | #304 | Tragic 3.8% |
| English | 0.0 /100 | #305 | Tragic 3.8% |
| Marshallese | 0.0 /100 | #306 | Tragic 3.8% |
| French Canadians | 0.0 /100 | #307 | Tragic 3.8% |
| Ottawa | 0.0 /100 | #308 | Tragic 3.8% |
| Scotch-Irish | 0.0 /100 | #309 | Tragic 3.8% |
Demographics Similar to Immigrants from Cameroon by Hearing Disability
In terms of hearing disability, the demographic groups most similar to Immigrants from Cameroon are Immigrants from Caribbean (2.6%, a difference of 0.010%), Bolivian (2.6%, a difference of 0.090%), Immigrants from Haiti (2.6%, a difference of 0.11%), Immigrants from Venezuela (2.6%, a difference of 0.14%), and Filipino (2.6%, a difference of 0.40%).
| Demographics | Rating | Rank | Hearing Disability |
| Immigrants | Ghana | 99.8 /100 | #24 | Exceptional 2.6% |
| Immigrants | El Salvador | 99.7 /100 | #25 | Exceptional 2.6% |
| Immigrants | Senegal | 99.7 /100 | #26 | Exceptional 2.6% |
| Immigrants | South Central Asia | 99.7 /100 | #27 | Exceptional 2.6% |
| Immigrants | Haiti | 99.7 /100 | #28 | Exceptional 2.6% |
| Bolivians | 99.7 /100 | #29 | Exceptional 2.6% |
| Immigrants | Caribbean | 99.7 /100 | #30 | Exceptional 2.6% |
| Immigrants | Cameroon | 99.7 /100 | #31 | Exceptional 2.6% |
| Immigrants | Venezuela | 99.7 /100 | #32 | Exceptional 2.6% |
| Filipinos | 99.6 /100 | #33 | Exceptional 2.6% |
| Immigrants | Pakistan | 99.6 /100 | #34 | Exceptional 2.6% |
| Salvadorans | 99.6 /100 | #35 | Exceptional 2.6% |
| Okinawans | 99.6 /100 | #36 | Exceptional 2.6% |
| Immigrants | Western Africa | 99.6 /100 | #37 | Exceptional 2.6% |
| Immigrants | Jamaica | 99.5 /100 | #38 | Exceptional 2.6% |