Hungarian vs Immigrants from Cameroon Hearing Disability
COMPARE
Hungarian
Immigrants from Cameroon
Hearing Disability
Hearing Disability Comparison
Hungarians
Immigrants from Cameroon
3.4%
HEARING DISABILITY
0.4/ 100
METRIC RATING
251st/ 347
METRIC RANK
2.6%
HEARING DISABILITY
99.7/ 100
METRIC RATING
31st/ 347
METRIC RANK
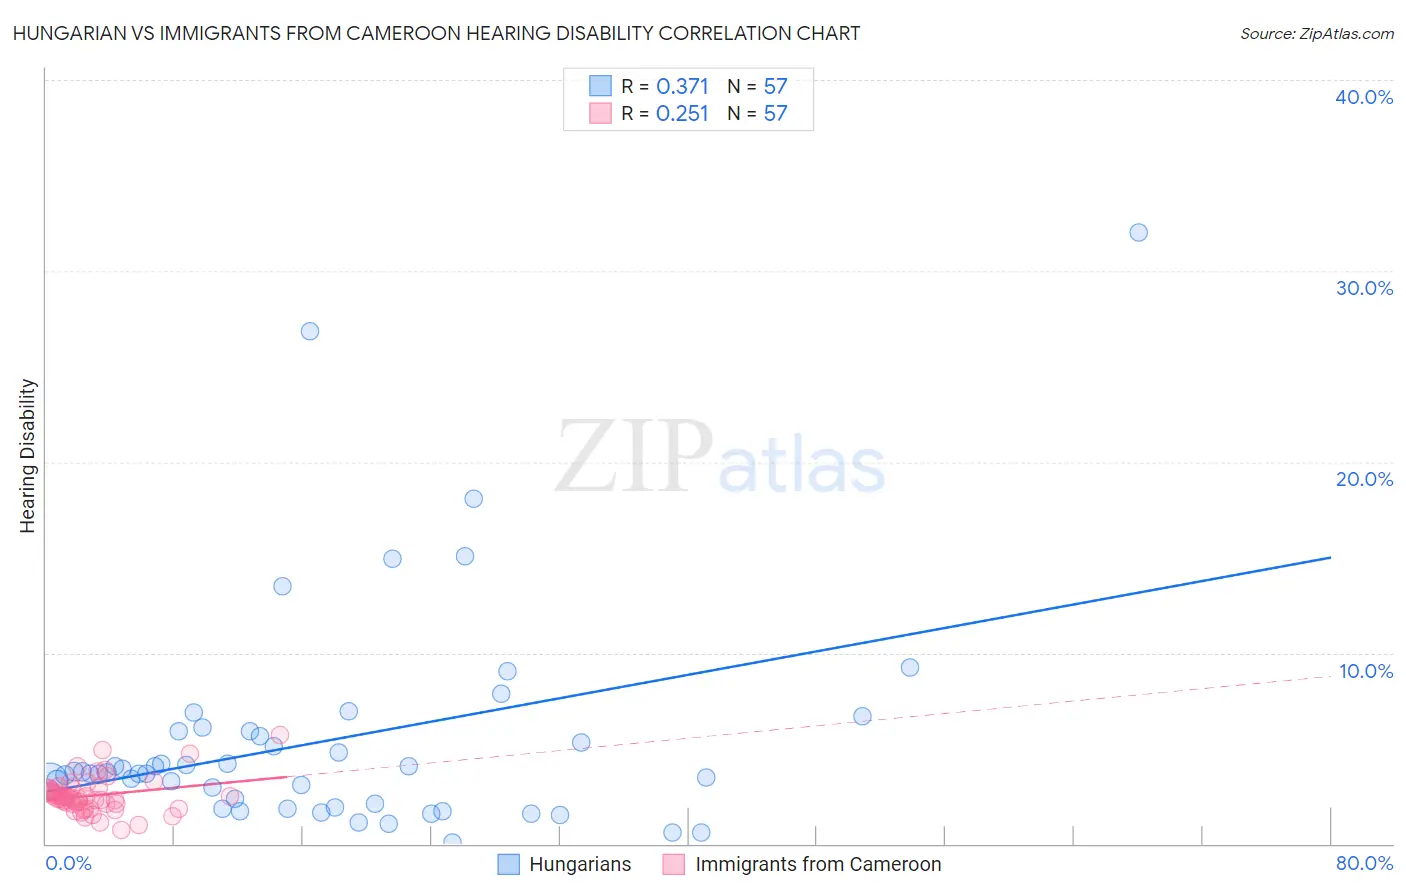
Hungarian vs Immigrants from Cameroon Hearing Disability Correlation Chart
The statistical analysis conducted on geographies consisting of 485,961,272 people shows a mild positive correlation between the proportion of Hungarians and percentage of population with hearing disability in the United States with a correlation coefficient (R) of 0.371 and weighted average of 3.4%. Similarly, the statistical analysis conducted on geographies consisting of 130,730,708 people shows a weak positive correlation between the proportion of Immigrants from Cameroon and percentage of population with hearing disability in the United States with a correlation coefficient (R) of 0.251 and weighted average of 2.6%, a difference of 30.5%.
Hearing Disability Correlation Summary
| Measurement | Hungarian | Immigrants from Cameroon |
| Minimum | 0.091% | 0.75% |
| Maximum | 32.0% | 5.7% |
| Range | 31.9% | 5.0% |
| Mean | 5.4% | 2.5% |
| Median | 3.7% | 2.4% |
| Interquartile 25% (IQ1) | 2.0% | 2.1% |
| Interquartile 75% (IQ3) | 5.9% | 2.8% |
| Interquartile Range (IQR) | 3.9% | 0.75% |
| Standard Deviation (Sample) | 5.9% | 0.91% |
| Standard Deviation (Population) | 5.8% | 0.90% |
Similar Demographics by Hearing Disability
Demographics Similar to Hungarians by Hearing Disability
In terms of hearing disability, the demographic groups most similar to Hungarians are Croatian (3.4%, a difference of 0.21%), Yuman (3.4%, a difference of 0.23%), Italian (3.4%, a difference of 0.24%), Carpatho Rusyn (3.4%, a difference of 0.66%), and Austrian (3.4%, a difference of 0.77%).
| Demographics | Rating | Rank | Hearing Disability |
| Assyrians/Chaldeans/Syriacs | 0.9 /100 | #244 | Tragic 3.3% |
| Immigrants | Scotland | 0.8 /100 | #245 | Tragic 3.3% |
| Immigrants | England | 0.7 /100 | #246 | Tragic 3.3% |
| Lithuanians | 0.6 /100 | #247 | Tragic 3.4% |
| Austrians | 0.6 /100 | #248 | Tragic 3.4% |
| Italians | 0.4 /100 | #249 | Tragic 3.4% |
| Yuman | 0.4 /100 | #250 | Tragic 3.4% |
| Hungarians | 0.4 /100 | #251 | Tragic 3.4% |
| Croatians | 0.4 /100 | #252 | Tragic 3.4% |
| Carpatho Rusyns | 0.3 /100 | #253 | Tragic 3.4% |
| Slavs | 0.2 /100 | #254 | Tragic 3.4% |
| Poles | 0.2 /100 | #255 | Tragic 3.4% |
| Hmong | 0.2 /100 | #256 | Tragic 3.4% |
| Yaqui | 0.2 /100 | #257 | Tragic 3.4% |
| Northern Europeans | 0.2 /100 | #258 | Tragic 3.4% |
Demographics Similar to Immigrants from Cameroon by Hearing Disability
In terms of hearing disability, the demographic groups most similar to Immigrants from Cameroon are Immigrants from Caribbean (2.6%, a difference of 0.010%), Bolivian (2.6%, a difference of 0.090%), Immigrants from Haiti (2.6%, a difference of 0.11%), Immigrants from Venezuela (2.6%, a difference of 0.14%), and Filipino (2.6%, a difference of 0.40%).
| Demographics | Rating | Rank | Hearing Disability |
| Immigrants | Ghana | 99.8 /100 | #24 | Exceptional 2.6% |
| Immigrants | El Salvador | 99.7 /100 | #25 | Exceptional 2.6% |
| Immigrants | Senegal | 99.7 /100 | #26 | Exceptional 2.6% |
| Immigrants | South Central Asia | 99.7 /100 | #27 | Exceptional 2.6% |
| Immigrants | Haiti | 99.7 /100 | #28 | Exceptional 2.6% |
| Bolivians | 99.7 /100 | #29 | Exceptional 2.6% |
| Immigrants | Caribbean | 99.7 /100 | #30 | Exceptional 2.6% |
| Immigrants | Cameroon | 99.7 /100 | #31 | Exceptional 2.6% |
| Immigrants | Venezuela | 99.7 /100 | #32 | Exceptional 2.6% |
| Filipinos | 99.6 /100 | #33 | Exceptional 2.6% |
| Immigrants | Pakistan | 99.6 /100 | #34 | Exceptional 2.6% |
| Salvadorans | 99.6 /100 | #35 | Exceptional 2.6% |
| Okinawans | 99.6 /100 | #36 | Exceptional 2.6% |
| Immigrants | Western Africa | 99.6 /100 | #37 | Exceptional 2.6% |
| Immigrants | Jamaica | 99.5 /100 | #38 | Exceptional 2.6% |