New Zealander vs Colombian Vision Disability
COMPARE
New Zealander
Colombian
Vision Disability
Vision Disability Comparison
New Zealanders
Colombians
2.1%
VISION DISABILITY
88.2/ 100
METRIC RATING
132nd/ 347
METRIC RANK
2.1%
VISION DISABILITY
76.2/ 100
METRIC RATING
149th/ 347
METRIC RANK
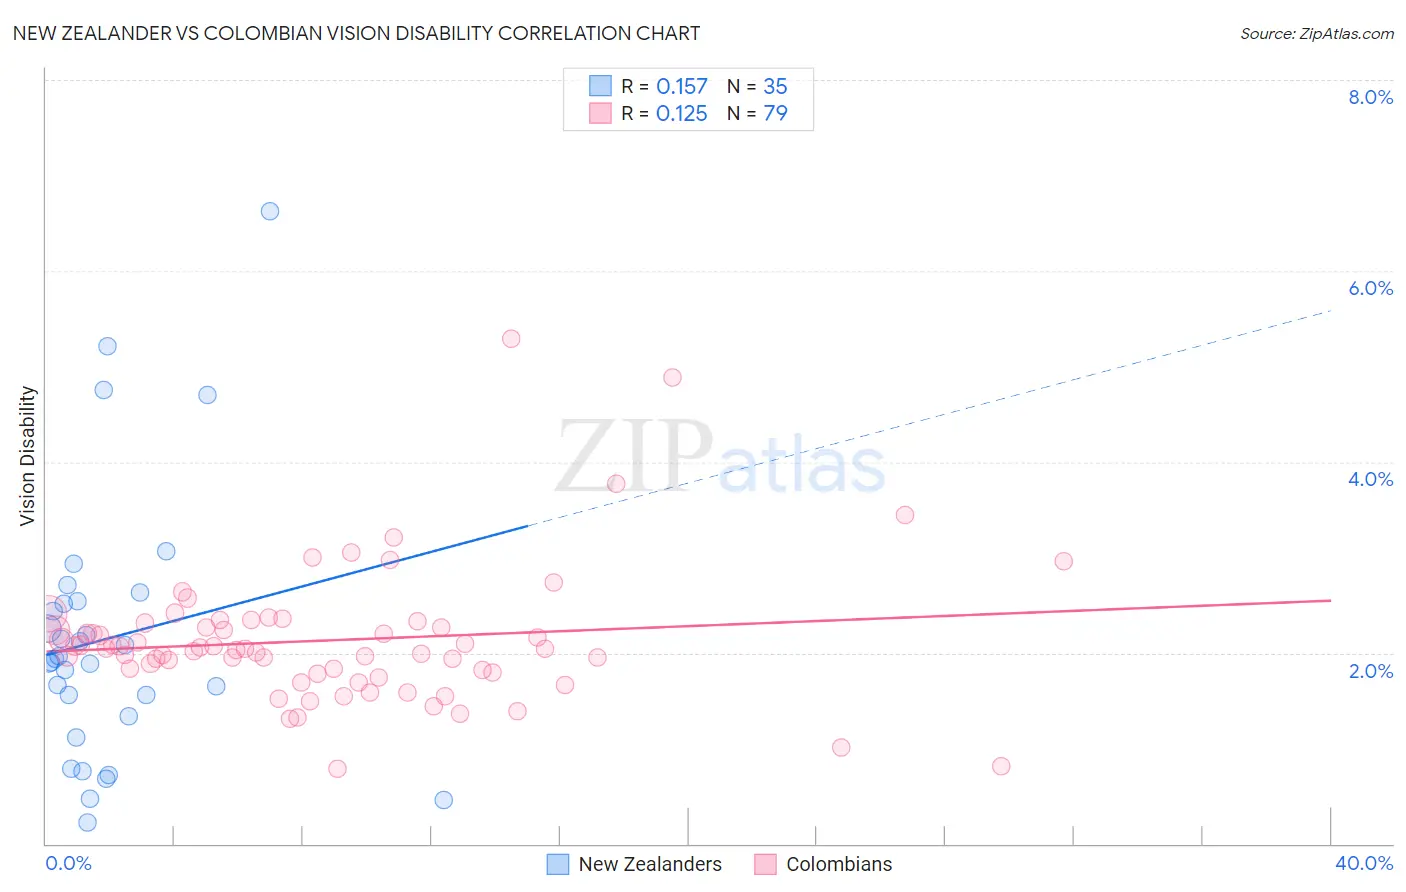
New Zealander vs Colombian Vision Disability Correlation Chart
The statistical analysis conducted on geographies consisting of 106,891,715 people shows a poor positive correlation between the proportion of New Zealanders and percentage of population with vision disability in the United States with a correlation coefficient (R) of 0.157 and weighted average of 2.1%. Similarly, the statistical analysis conducted on geographies consisting of 419,253,931 people shows a poor positive correlation between the proportion of Colombians and percentage of population with vision disability in the United States with a correlation coefficient (R) of 0.125 and weighted average of 2.1%, a difference of 1.4%.
Vision Disability Correlation Summary
| Measurement | New Zealander | Colombian |
| Minimum | 0.22% | 0.78% |
| Maximum | 6.6% | 5.3% |
| Range | 6.4% | 4.5% |
| Mean | 2.2% | 2.1% |
| Median | 1.9% | 2.0% |
| Interquartile 25% (IQ1) | 1.3% | 1.8% |
| Interquartile 75% (IQ3) | 2.5% | 2.3% |
| Interquartile Range (IQR) | 1.2% | 0.52% |
| Standard Deviation (Sample) | 1.4% | 0.71% |
| Standard Deviation (Population) | 1.4% | 0.70% |
Demographics Similar to New Zealanders and Colombians by Vision Disability
In terms of vision disability, the demographic groups most similar to New Zealanders are Immigrants from Hungary (2.1%, a difference of 0.080%), Immigrants from Kenya (2.1%, a difference of 0.090%), Syrian (2.1%, a difference of 0.10%), Venezuelan (2.1%, a difference of 0.15%), and Vietnamese (2.1%, a difference of 0.22%). Similarly, the demographic groups most similar to Colombians are Belgian (2.1%, a difference of 0.030%), Finnish (2.1%, a difference of 0.19%), Immigrants from Sudan (2.1%, a difference of 0.20%), Italian (2.1%, a difference of 0.33%), and Immigrants from Bosnia and Herzegovina (2.1%, a difference of 0.51%).
| Demographics | Rating | Rank | Vision Disability |
| Immigrants | Kenya | 88.7 /100 | #130 | Excellent 2.1% |
| Immigrants | Hungary | 88.7 /100 | #131 | Excellent 2.1% |
| New Zealanders | 88.2 /100 | #132 | Excellent 2.1% |
| Syrians | 87.5 /100 | #133 | Excellent 2.1% |
| Venezuelans | 87.2 /100 | #134 | Excellent 2.1% |
| Vietnamese | 86.7 /100 | #135 | Excellent 2.1% |
| Czechs | 86.3 /100 | #136 | Excellent 2.1% |
| Immigrants | South Eastern Asia | 86.3 /100 | #137 | Excellent 2.1% |
| Arabs | 86.3 /100 | #138 | Excellent 2.1% |
| Immigrants | Morocco | 85.2 /100 | #139 | Excellent 2.1% |
| Immigrants | Netherlands | 84.2 /100 | #140 | Excellent 2.1% |
| Sierra Leoneans | 84.1 /100 | #141 | Excellent 2.1% |
| South Americans | 82.8 /100 | #142 | Excellent 2.1% |
| Immigrants | Sierra Leone | 82.8 /100 | #143 | Excellent 2.1% |
| Ukrainians | 81.9 /100 | #144 | Excellent 2.1% |
| Immigrants | Bosnia and Herzegovina | 81.5 /100 | #145 | Excellent 2.1% |
| Italians | 79.7 /100 | #146 | Good 2.1% |
| Immigrants | Sudan | 78.4 /100 | #147 | Good 2.1% |
| Finns | 78.3 /100 | #148 | Good 2.1% |
| Colombians | 76.2 /100 | #149 | Good 2.1% |
| Belgians | 75.9 /100 | #150 | Good 2.1% |