Israeli vs Colombian Vision Disability
COMPARE
Israeli
Colombian
Vision Disability
Vision Disability Comparison
Israelis
Colombians
2.0%
VISION DISABILITY
99.6/ 100
METRIC RATING
48th/ 347
METRIC RANK
2.1%
VISION DISABILITY
76.2/ 100
METRIC RATING
149th/ 347
METRIC RANK
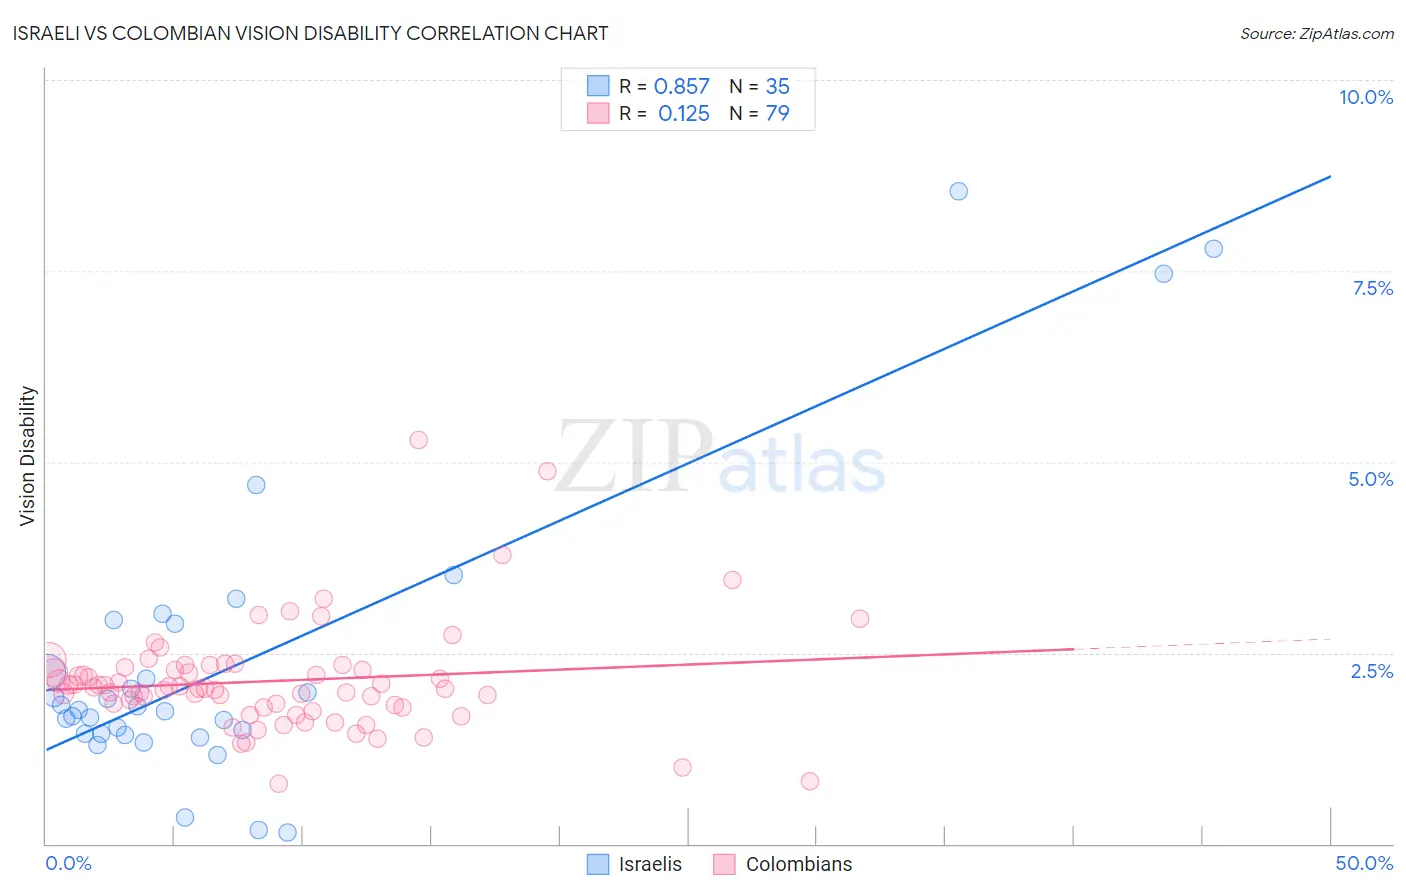
Israeli vs Colombian Vision Disability Correlation Chart
The statistical analysis conducted on geographies consisting of 211,077,295 people shows a very strong positive correlation between the proportion of Israelis and percentage of population with vision disability in the United States with a correlation coefficient (R) of 0.857 and weighted average of 2.0%. Similarly, the statistical analysis conducted on geographies consisting of 419,253,931 people shows a poor positive correlation between the proportion of Colombians and percentage of population with vision disability in the United States with a correlation coefficient (R) of 0.125 and weighted average of 2.1%, a difference of 7.3%.
Vision Disability Correlation Summary
| Measurement | Israeli | Colombian |
| Minimum | 0.15% | 0.78% |
| Maximum | 8.5% | 5.3% |
| Range | 8.4% | 4.5% |
| Mean | 2.4% | 2.1% |
| Median | 1.8% | 2.0% |
| Interquartile 25% (IQ1) | 1.4% | 1.8% |
| Interquartile 75% (IQ3) | 2.9% | 2.3% |
| Interquartile Range (IQR) | 1.4% | 0.52% |
| Standard Deviation (Sample) | 1.9% | 0.71% |
| Standard Deviation (Population) | 1.9% | 0.70% |
Similar Demographics by Vision Disability
Demographics Similar to Israelis by Vision Disability
In terms of vision disability, the demographic groups most similar to Israelis are Latvian (2.0%, a difference of 0.070%), Afghan (2.0%, a difference of 0.13%), Tongan (2.0%, a difference of 0.22%), Immigrants from Bulgaria (2.0%, a difference of 0.46%), and Immigrants from Sweden (2.0%, a difference of 0.48%).
| Demographics | Rating | Rank | Vision Disability |
| Cypriots | 99.7 /100 | #41 | Exceptional 2.0% |
| Immigrants | Ethiopia | 99.7 /100 | #42 | Exceptional 2.0% |
| Eastern Europeans | 99.7 /100 | #43 | Exceptional 2.0% |
| Immigrants | Indonesia | 99.7 /100 | #44 | Exceptional 2.0% |
| Ethiopians | 99.7 /100 | #45 | Exceptional 2.0% |
| Immigrants | Sweden | 99.7 /100 | #46 | Exceptional 2.0% |
| Immigrants | Bulgaria | 99.7 /100 | #47 | Exceptional 2.0% |
| Israelis | 99.6 /100 | #48 | Exceptional 2.0% |
| Latvians | 99.5 /100 | #49 | Exceptional 2.0% |
| Afghans | 99.5 /100 | #50 | Exceptional 2.0% |
| Tongans | 99.5 /100 | #51 | Exceptional 2.0% |
| Immigrants | Serbia | 99.4 /100 | #52 | Exceptional 2.0% |
| Immigrants | Belarus | 99.3 /100 | #53 | Exceptional 2.0% |
| Macedonians | 99.3 /100 | #54 | Exceptional 2.0% |
| Laotians | 99.3 /100 | #55 | Exceptional 2.0% |
Demographics Similar to Colombians by Vision Disability
In terms of vision disability, the demographic groups most similar to Colombians are Belgian (2.1%, a difference of 0.030%), Immigrants from Norway (2.1%, a difference of 0.070%), Immigrants from Southern Europe (2.1%, a difference of 0.14%), Finnish (2.1%, a difference of 0.19%), and Immigrants from Sudan (2.1%, a difference of 0.20%).
| Demographics | Rating | Rank | Vision Disability |
| South Americans | 82.8 /100 | #142 | Excellent 2.1% |
| Immigrants | Sierra Leone | 82.8 /100 | #143 | Excellent 2.1% |
| Ukrainians | 81.9 /100 | #144 | Excellent 2.1% |
| Immigrants | Bosnia and Herzegovina | 81.5 /100 | #145 | Excellent 2.1% |
| Italians | 79.7 /100 | #146 | Good 2.1% |
| Immigrants | Sudan | 78.4 /100 | #147 | Good 2.1% |
| Finns | 78.3 /100 | #148 | Good 2.1% |
| Colombians | 76.2 /100 | #149 | Good 2.1% |
| Belgians | 75.9 /100 | #150 | Good 2.1% |
| Immigrants | Norway | 75.5 /100 | #151 | Good 2.1% |
| Immigrants | Southern Europe | 74.6 /100 | #152 | Good 2.1% |
| Immigrants | South America | 73.8 /100 | #153 | Good 2.1% |
| Slovenes | 73.6 /100 | #154 | Good 2.1% |
| Immigrants | Colombia | 72.1 /100 | #155 | Good 2.1% |
| Pakistanis | 71.6 /100 | #156 | Good 2.1% |