Marshallese vs Colombian Vision Disability
COMPARE
Marshallese
Colombian
Vision Disability
Vision Disability Comparison
Marshallese
Colombians
2.3%
VISION DISABILITY
1.5/ 100
METRIC RATING
235th/ 347
METRIC RANK
2.1%
VISION DISABILITY
76.2/ 100
METRIC RATING
149th/ 347
METRIC RANK
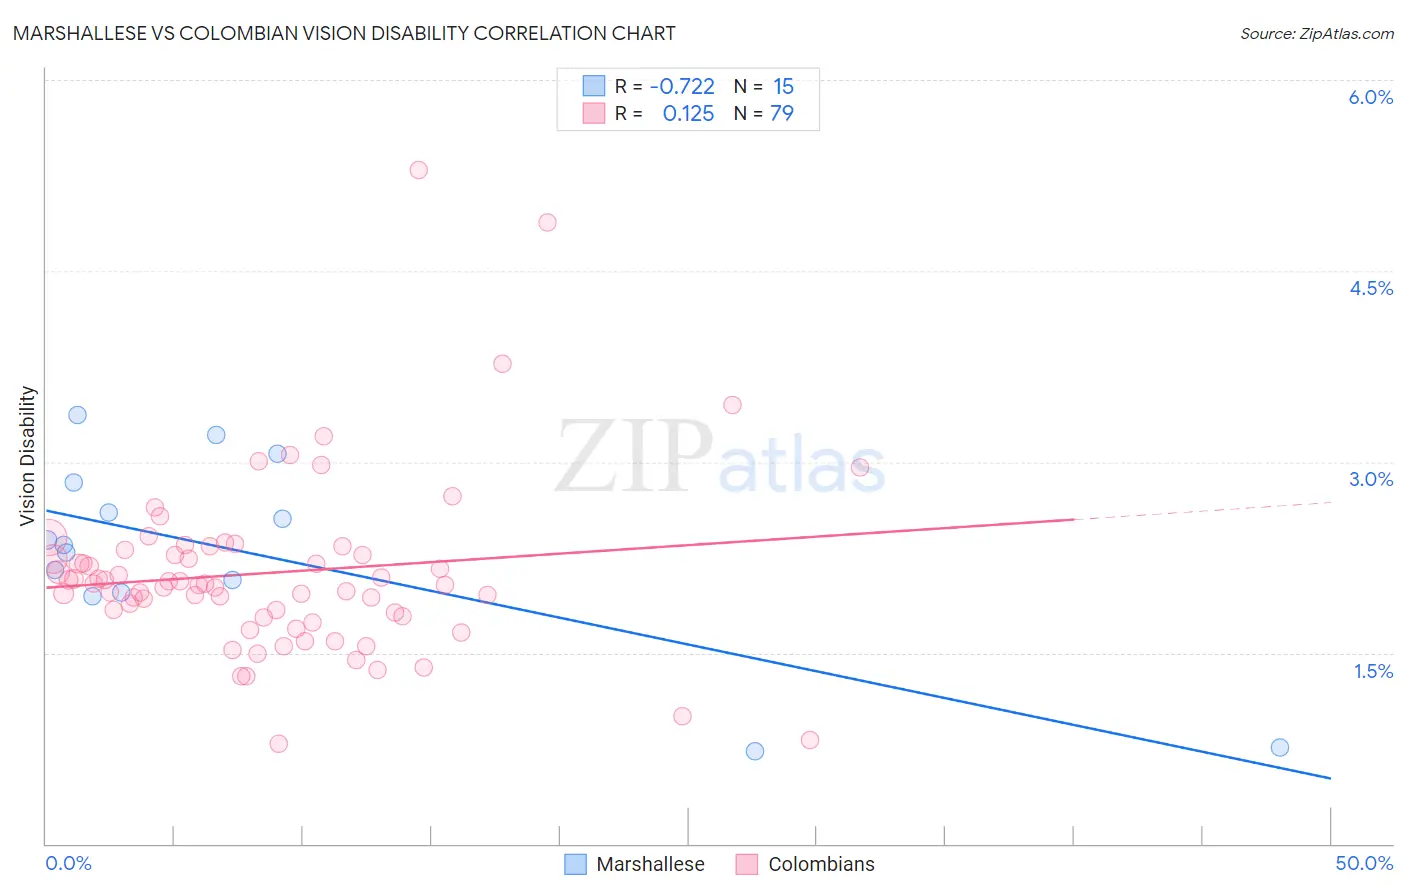
Marshallese vs Colombian Vision Disability Correlation Chart
The statistical analysis conducted on geographies consisting of 14,759,042 people shows a strong negative correlation between the proportion of Marshallese and percentage of population with vision disability in the United States with a correlation coefficient (R) of -0.722 and weighted average of 2.3%. Similarly, the statistical analysis conducted on geographies consisting of 419,253,931 people shows a poor positive correlation between the proportion of Colombians and percentage of population with vision disability in the United States with a correlation coefficient (R) of 0.125 and weighted average of 2.1%, a difference of 8.6%.
Vision Disability Correlation Summary
| Measurement | Marshallese | Colombian |
| Minimum | 0.72% | 0.78% |
| Maximum | 3.4% | 5.3% |
| Range | 2.6% | 4.5% |
| Mean | 2.3% | 2.1% |
| Median | 2.4% | 2.0% |
| Interquartile 25% (IQ1) | 2.0% | 1.8% |
| Interquartile 75% (IQ3) | 2.8% | 2.3% |
| Interquartile Range (IQR) | 0.86% | 0.52% |
| Standard Deviation (Sample) | 0.76% | 0.71% |
| Standard Deviation (Population) | 0.74% | 0.70% |
Similar Demographics by Vision Disability
Demographics Similar to Marshallese by Vision Disability
In terms of vision disability, the demographic groups most similar to Marshallese are Scottish (2.3%, a difference of 0.070%), Immigrants from Congo (2.3%, a difference of 0.090%), Immigrants from Portugal (2.3%, a difference of 0.14%), Central American (2.3%, a difference of 0.25%), and German Russian (2.3%, a difference of 0.27%).
| Demographics | Rating | Rank | Vision Disability |
| Hmong | 2.5 /100 | #228 | Tragic 2.3% |
| Welsh | 2.3 /100 | #229 | Tragic 2.3% |
| Nicaraguans | 2.2 /100 | #230 | Tragic 2.3% |
| Immigrants | Ecuador | 2.0 /100 | #231 | Tragic 2.3% |
| German Russians | 1.8 /100 | #232 | Tragic 2.3% |
| Central Americans | 1.8 /100 | #233 | Tragic 2.3% |
| Scottish | 1.6 /100 | #234 | Tragic 2.3% |
| Marshallese | 1.5 /100 | #235 | Tragic 2.3% |
| Immigrants | Congo | 1.4 /100 | #236 | Tragic 2.3% |
| Immigrants | Portugal | 1.4 /100 | #237 | Tragic 2.3% |
| Immigrants | Cambodia | 1.1 /100 | #238 | Tragic 2.3% |
| English | 1.1 /100 | #239 | Tragic 2.3% |
| Panamanians | 0.9 /100 | #240 | Tragic 2.3% |
| Malaysians | 0.9 /100 | #241 | Tragic 2.3% |
| Immigrants | Panama | 0.8 /100 | #242 | Tragic 2.3% |
Demographics Similar to Colombians by Vision Disability
In terms of vision disability, the demographic groups most similar to Colombians are Belgian (2.1%, a difference of 0.030%), Immigrants from Norway (2.1%, a difference of 0.070%), Immigrants from Southern Europe (2.1%, a difference of 0.14%), Finnish (2.1%, a difference of 0.19%), and Immigrants from Sudan (2.1%, a difference of 0.20%).
| Demographics | Rating | Rank | Vision Disability |
| South Americans | 82.8 /100 | #142 | Excellent 2.1% |
| Immigrants | Sierra Leone | 82.8 /100 | #143 | Excellent 2.1% |
| Ukrainians | 81.9 /100 | #144 | Excellent 2.1% |
| Immigrants | Bosnia and Herzegovina | 81.5 /100 | #145 | Excellent 2.1% |
| Italians | 79.7 /100 | #146 | Good 2.1% |
| Immigrants | Sudan | 78.4 /100 | #147 | Good 2.1% |
| Finns | 78.3 /100 | #148 | Good 2.1% |
| Colombians | 76.2 /100 | #149 | Good 2.1% |
| Belgians | 75.9 /100 | #150 | Good 2.1% |
| Immigrants | Norway | 75.5 /100 | #151 | Good 2.1% |
| Immigrants | Southern Europe | 74.6 /100 | #152 | Good 2.1% |
| Immigrants | South America | 73.8 /100 | #153 | Good 2.1% |
| Slovenes | 73.6 /100 | #154 | Good 2.1% |
| Immigrants | Colombia | 72.1 /100 | #155 | Good 2.1% |
| Pakistanis | 71.6 /100 | #156 | Good 2.1% |