Immigrants from Honduras vs Colombian Vision Disability
COMPARE
Immigrants from Honduras
Colombian
Vision Disability
Vision Disability Comparison
Immigrants from Honduras
Colombians
2.5%
VISION DISABILITY
0.0/ 100
METRIC RATING
291st/ 347
METRIC RANK
2.1%
VISION DISABILITY
76.2/ 100
METRIC RATING
149th/ 347
METRIC RANK
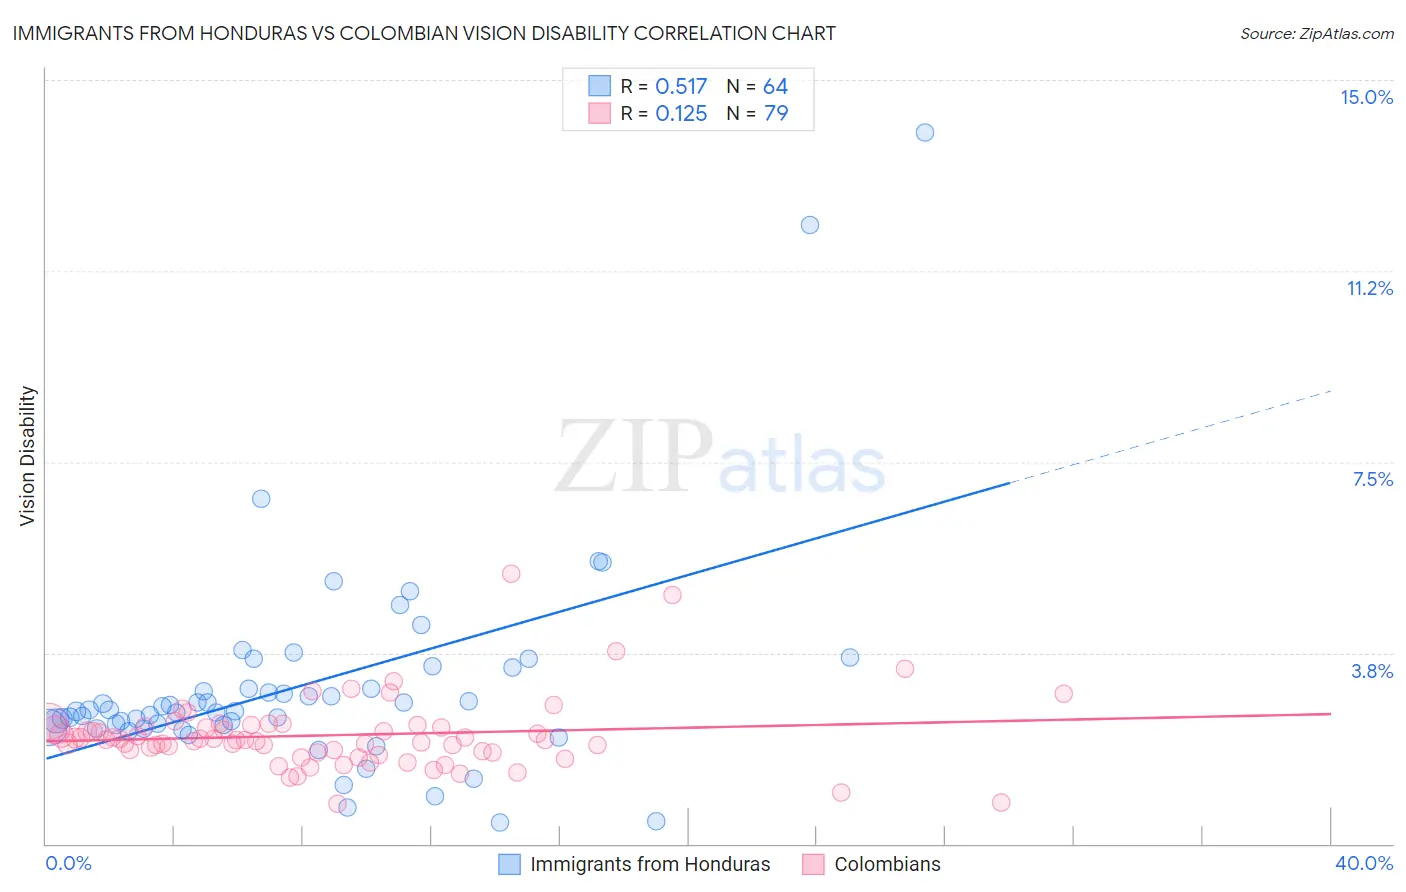
Immigrants from Honduras vs Colombian Vision Disability Correlation Chart
The statistical analysis conducted on geographies consisting of 322,475,782 people shows a substantial positive correlation between the proportion of Immigrants from Honduras and percentage of population with vision disability in the United States with a correlation coefficient (R) of 0.517 and weighted average of 2.5%. Similarly, the statistical analysis conducted on geographies consisting of 419,253,931 people shows a poor positive correlation between the proportion of Colombians and percentage of population with vision disability in the United States with a correlation coefficient (R) of 0.125 and weighted average of 2.1%, a difference of 17.2%.
Vision Disability Correlation Summary
| Measurement | Immigrants from Honduras | Colombian |
| Minimum | 0.42% | 0.78% |
| Maximum | 14.0% | 5.3% |
| Range | 13.5% | 4.5% |
| Mean | 3.1% | 2.1% |
| Median | 2.6% | 2.0% |
| Interquartile 25% (IQ1) | 2.3% | 1.8% |
| Interquartile 75% (IQ3) | 3.3% | 2.3% |
| Interquartile Range (IQR) | 0.94% | 0.52% |
| Standard Deviation (Sample) | 2.1% | 0.71% |
| Standard Deviation (Population) | 2.1% | 0.70% |
Similar Demographics by Vision Disability
Demographics Similar to Immigrants from Honduras by Vision Disability
In terms of vision disability, the demographic groups most similar to Immigrants from Honduras are Crow (2.5%, a difference of 0.10%), Yaqui (2.5%, a difference of 0.12%), Immigrants from Cuba (2.5%, a difference of 0.39%), Ottawa (2.5%, a difference of 0.46%), and Nonimmigrants (2.5%, a difference of 0.53%).
| Demographics | Rating | Rank | Vision Disability |
| Yakama | 0.0 /100 | #284 | Tragic 2.5% |
| Immigrants | Central America | 0.0 /100 | #285 | Tragic 2.5% |
| Sioux | 0.0 /100 | #286 | Tragic 2.5% |
| Hondurans | 0.0 /100 | #287 | Tragic 2.5% |
| French American Indians | 0.0 /100 | #288 | Tragic 2.5% |
| Immigrants | Nonimmigrants | 0.0 /100 | #289 | Tragic 2.5% |
| Immigrants | Cuba | 0.0 /100 | #290 | Tragic 2.5% |
| Immigrants | Honduras | 0.0 /100 | #291 | Tragic 2.5% |
| Crow | 0.0 /100 | #292 | Tragic 2.5% |
| Yaqui | 0.0 /100 | #293 | Tragic 2.5% |
| Ottawa | 0.0 /100 | #294 | Tragic 2.5% |
| Delaware | 0.0 /100 | #295 | Tragic 2.5% |
| Immigrants | Mexico | 0.0 /100 | #296 | Tragic 2.5% |
| Immigrants | Dominica | 0.0 /100 | #297 | Tragic 2.5% |
| Mexicans | 0.0 /100 | #298 | Tragic 2.5% |
Demographics Similar to Colombians by Vision Disability
In terms of vision disability, the demographic groups most similar to Colombians are Belgian (2.1%, a difference of 0.030%), Immigrants from Norway (2.1%, a difference of 0.070%), Immigrants from Southern Europe (2.1%, a difference of 0.14%), Finnish (2.1%, a difference of 0.19%), and Immigrants from Sudan (2.1%, a difference of 0.20%).
| Demographics | Rating | Rank | Vision Disability |
| South Americans | 82.8 /100 | #142 | Excellent 2.1% |
| Immigrants | Sierra Leone | 82.8 /100 | #143 | Excellent 2.1% |
| Ukrainians | 81.9 /100 | #144 | Excellent 2.1% |
| Immigrants | Bosnia and Herzegovina | 81.5 /100 | #145 | Excellent 2.1% |
| Italians | 79.7 /100 | #146 | Good 2.1% |
| Immigrants | Sudan | 78.4 /100 | #147 | Good 2.1% |
| Finns | 78.3 /100 | #148 | Good 2.1% |
| Colombians | 76.2 /100 | #149 | Good 2.1% |
| Belgians | 75.9 /100 | #150 | Good 2.1% |
| Immigrants | Norway | 75.5 /100 | #151 | Good 2.1% |
| Immigrants | Southern Europe | 74.6 /100 | #152 | Good 2.1% |
| Immigrants | South America | 73.8 /100 | #153 | Good 2.1% |
| Slovenes | 73.6 /100 | #154 | Good 2.1% |
| Immigrants | Colombia | 72.1 /100 | #155 | Good 2.1% |
| Pakistanis | 71.6 /100 | #156 | Good 2.1% |