Immigrants from England vs Slovene Disability
COMPARE
Immigrants from England
Slovene
Disability
Disability Comparison
Immigrants from England
Slovenes
12.0%
DISABILITY
12.0/ 100
METRIC RATING
202nd/ 347
METRIC RANK
12.4%
DISABILITY
0.6/ 100
METRIC RATING
255th/ 347
METRIC RANK
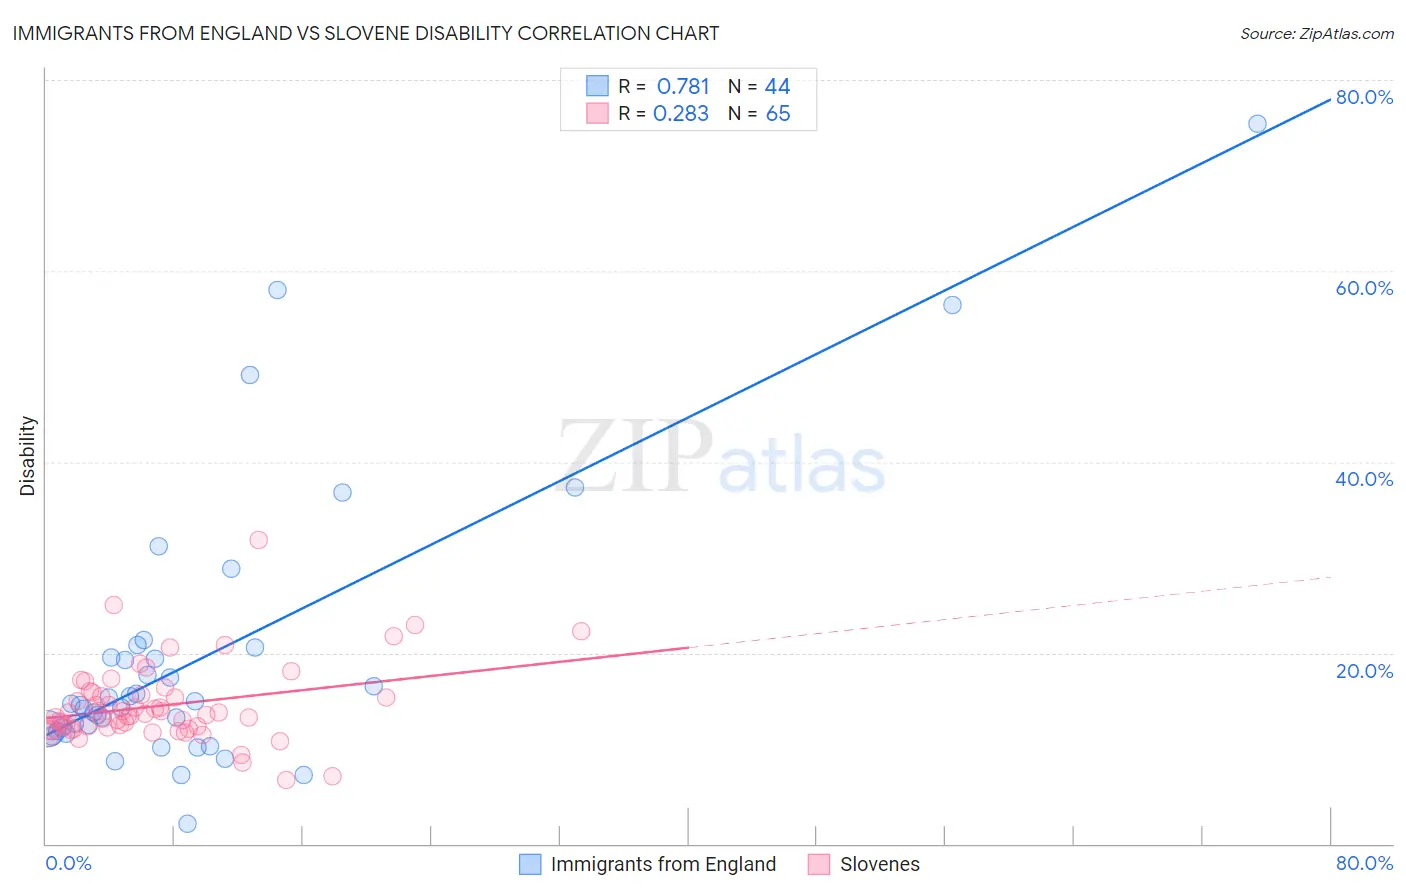
Immigrants from England vs Slovene Disability Correlation Chart
The statistical analysis conducted on geographies consisting of 391,892,712 people shows a strong positive correlation between the proportion of Immigrants from England and percentage of population with a disability in the United States with a correlation coefficient (R) of 0.781 and weighted average of 12.0%. Similarly, the statistical analysis conducted on geographies consisting of 261,350,851 people shows a weak positive correlation between the proportion of Slovenes and percentage of population with a disability in the United States with a correlation coefficient (R) of 0.283 and weighted average of 12.4%, a difference of 3.4%.
Disability Correlation Summary
| Measurement | Immigrants from England | Slovene |
| Minimum | 2.1% | 6.7% |
| Maximum | 75.4% | 31.8% |
| Range | 73.3% | 25.1% |
| Mean | 19.7% | 14.5% |
| Median | 14.6% | 13.5% |
| Interquartile 25% (IQ1) | 11.9% | 12.1% |
| Interquartile 75% (IQ3) | 20.1% | 15.7% |
| Interquartile Range (IQR) | 8.1% | 3.6% |
| Standard Deviation (Sample) | 14.9% | 4.1% |
| Standard Deviation (Population) | 14.7% | 4.1% |
Similar Demographics by Disability
Demographics Similar to Immigrants from England by Disability
In terms of disability, the demographic groups most similar to Immigrants from England are British West Indian (12.0%, a difference of 0.050%), Mexican American Indian (12.0%, a difference of 0.050%), Assyrian/Chaldean/Syriac (11.9%, a difference of 0.070%), Belizean (11.9%, a difference of 0.090%), and Immigrants from Western Europe (12.0%, a difference of 0.21%).
| Demographics | Rating | Rank | Disability |
| Barbadians | 15.8 /100 | #195 | Poor 11.9% |
| Serbians | 15.4 /100 | #196 | Poor 11.9% |
| Immigrants | Belize | 15.2 /100 | #197 | Poor 11.9% |
| Ukrainians | 14.7 /100 | #198 | Poor 11.9% |
| Immigrants | Panama | 14.6 /100 | #199 | Poor 11.9% |
| Belizeans | 12.8 /100 | #200 | Poor 11.9% |
| Assyrians/Chaldeans/Syriacs | 12.6 /100 | #201 | Poor 11.9% |
| Immigrants | England | 12.0 /100 | #202 | Poor 12.0% |
| British West Indians | 11.5 /100 | #203 | Poor 12.0% |
| Mexican American Indians | 11.4 /100 | #204 | Poor 12.0% |
| Immigrants | Western Europe | 10.1 /100 | #205 | Poor 12.0% |
| Immigrants | Senegal | 9.4 /100 | #206 | Tragic 12.0% |
| Immigrants | Thailand | 9.3 /100 | #207 | Tragic 12.0% |
| Immigrants | Caribbean | 9.1 /100 | #208 | Tragic 12.0% |
| Danes | 8.7 /100 | #209 | Tragic 12.0% |
Demographics Similar to Slovenes by Disability
In terms of disability, the demographic groups most similar to Slovenes are Immigrants from Dominica (12.4%, a difference of 0.070%), Immigrants from Laos (12.4%, a difference of 0.16%), Slavic (12.4%, a difference of 0.30%), German Russian (12.3%, a difference of 0.33%), and Belgian (12.3%, a difference of 0.35%).
| Demographics | Rating | Rank | Disability |
| Guamanians/Chamorros | 1.4 /100 | #248 | Tragic 12.3% |
| Carpatho Rusyns | 1.4 /100 | #249 | Tragic 12.3% |
| Sub-Saharan Africans | 1.4 /100 | #250 | Tragic 12.3% |
| Europeans | 1.4 /100 | #251 | Tragic 12.3% |
| Bermudans | 1.1 /100 | #252 | Tragic 12.3% |
| Belgians | 0.8 /100 | #253 | Tragic 12.3% |
| German Russians | 0.8 /100 | #254 | Tragic 12.3% |
| Slovenes | 0.6 /100 | #255 | Tragic 12.4% |
| Immigrants | Dominica | 0.6 /100 | #256 | Tragic 12.4% |
| Immigrants | Laos | 0.5 /100 | #257 | Tragic 12.4% |
| Slavs | 0.5 /100 | #258 | Tragic 12.4% |
| Canadians | 0.4 /100 | #259 | Tragic 12.4% |
| Immigrants | Liberia | 0.4 /100 | #260 | Tragic 12.4% |
| Scandinavians | 0.4 /100 | #261 | Tragic 12.4% |
| Native Hawaiians | 0.3 /100 | #262 | Tragic 12.5% |