Swedish vs Slovene Median Household Income
COMPARE
Swedish
Slovene
Median Household Income
Median Household Income Comparison
Swedes
Slovenes
$88,524
MEDIAN HOUSEHOLD INCOME
90.0/ 100
METRIC RATING
134th/ 347
METRIC RANK
$85,562
MEDIAN HOUSEHOLD INCOME
57.4/ 100
METRIC RATING
172nd/ 347
METRIC RANK
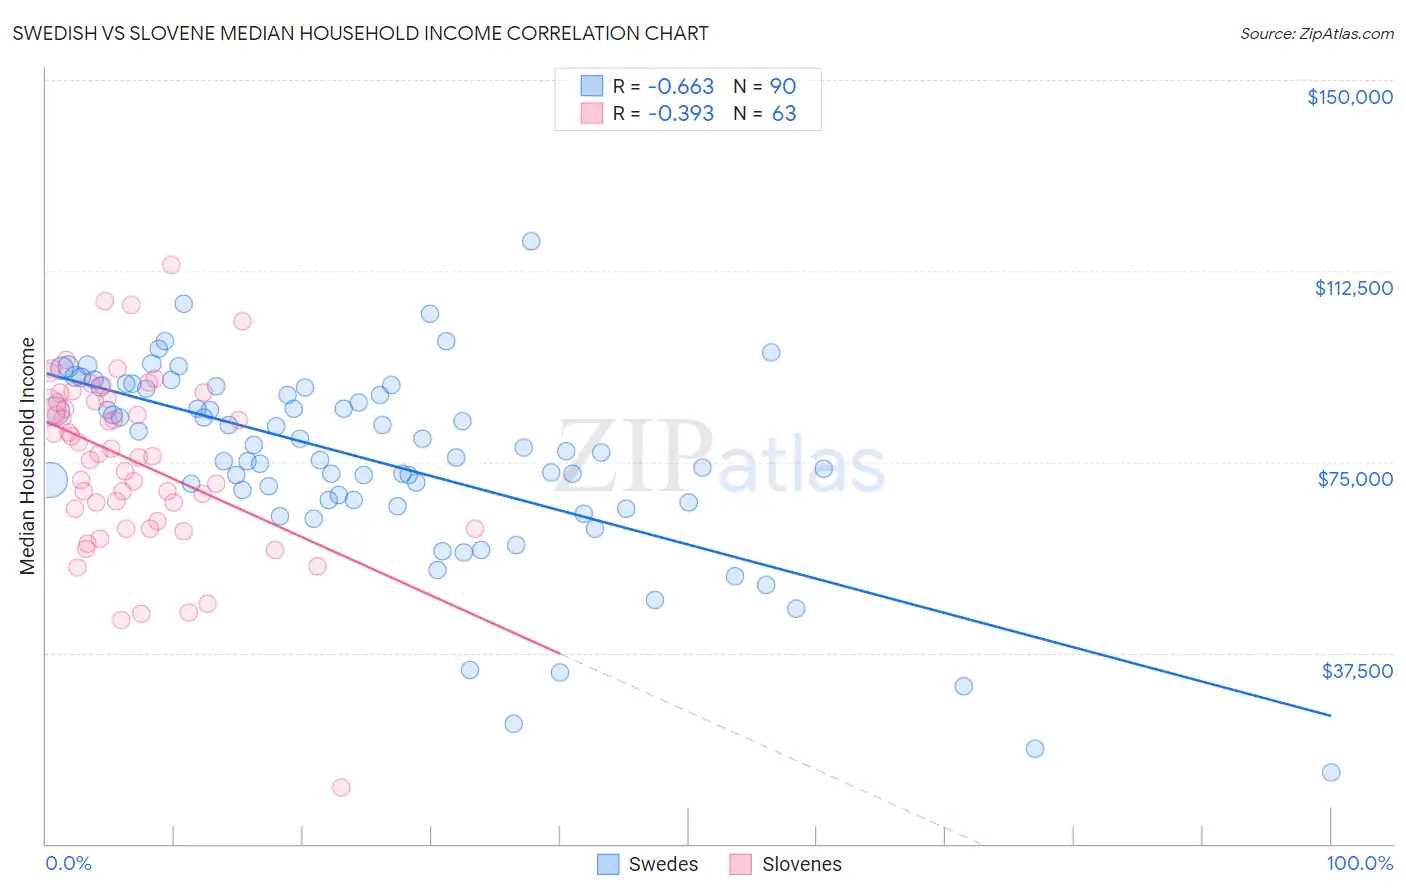
Swedish vs Slovene Median Household Income Correlation Chart
The statistical analysis conducted on geographies consisting of 538,472,836 people shows a significant negative correlation between the proportion of Swedes and median household income in the United States with a correlation coefficient (R) of -0.663 and weighted average of $88,524. Similarly, the statistical analysis conducted on geographies consisting of 261,226,883 people shows a mild negative correlation between the proportion of Slovenes and median household income in the United States with a correlation coefficient (R) of -0.393 and weighted average of $85,562, a difference of 3.5%.
Median Household Income Correlation Summary
| Measurement | Swedish | Slovene |
| Minimum | $14,107 | $11,161 |
| Maximum | $118,333 | $113,650 |
| Range | $104,226 | $102,489 |
| Mean | $75,217 | $75,280 |
| Median | $76,969 | $76,693 |
| Interquartile 25% (IQ1) | $67,408 | $63,438 |
| Interquartile 75% (IQ3) | $89,464 | $87,449 |
| Interquartile Range (IQR) | $22,056 | $24,011 |
| Standard Deviation (Sample) | $18,981 | $17,550 |
| Standard Deviation (Population) | $18,875 | $17,410 |
Similar Demographics by Median Household Income
Demographics Similar to Swedes by Median Household Income
In terms of median household income, the demographic groups most similar to Swedes are Immigrants from Sierra Leone ($88,498, a difference of 0.030%), Polish ($88,472, a difference of 0.060%), Sierra Leonean ($88,463, a difference of 0.070%), Arab ($88,398, a difference of 0.14%), and Immigrants from Chile ($88,388, a difference of 0.15%).
| Demographics | Rating | Rank | Median Household Income |
| Immigrants | Peru | 92.5 /100 | #127 | Exceptional $89,010 |
| Portuguese | 92.3 /100 | #128 | Exceptional $88,976 |
| Brazilians | 92.1 /100 | #129 | Exceptional $88,934 |
| British | 92.0 /100 | #130 | Exceptional $88,914 |
| Immigrants | Syria | 91.4 /100 | #131 | Exceptional $88,792 |
| Europeans | 91.2 /100 | #132 | Exceptional $88,751 |
| Immigrants | Ethiopia | 90.9 /100 | #133 | Exceptional $88,687 |
| Swedes | 90.0 /100 | #134 | Exceptional $88,524 |
| Immigrants | Sierra Leone | 89.9 /100 | #135 | Excellent $88,498 |
| Poles | 89.7 /100 | #136 | Excellent $88,472 |
| Sierra Leoneans | 89.6 /100 | #137 | Excellent $88,463 |
| Arabs | 89.2 /100 | #138 | Excellent $88,398 |
| Immigrants | Chile | 89.2 /100 | #139 | Excellent $88,388 |
| Lebanese | 87.2 /100 | #140 | Excellent $88,091 |
| Immigrants | Morocco | 86.0 /100 | #141 | Excellent $87,930 |
Demographics Similar to Slovenes by Median Household Income
In terms of median household income, the demographic groups most similar to Slovenes are Immigrants from South America ($85,611, a difference of 0.060%), Swiss ($85,681, a difference of 0.14%), Colombian ($85,716, a difference of 0.18%), Icelander ($85,797, a difference of 0.27%), and Immigrants from Cameroon ($85,314, a difference of 0.29%).
| Demographics | Rating | Rank | Median Household Income |
| Norwegians | 65.3 /100 | #165 | Good $86,084 |
| Scandinavians | 65.1 /100 | #166 | Good $86,073 |
| Immigrants | Immigrants | 61.3 /100 | #167 | Good $85,818 |
| Icelanders | 61.0 /100 | #168 | Good $85,797 |
| Colombians | 59.7 /100 | #169 | Average $85,716 |
| Swiss | 59.2 /100 | #170 | Average $85,681 |
| Immigrants | South America | 58.1 /100 | #171 | Average $85,611 |
| Slovenes | 57.4 /100 | #172 | Average $85,562 |
| Immigrants | Cameroon | 53.4 /100 | #173 | Average $85,314 |
| Scottish | 50.0 /100 | #174 | Average $85,101 |
| Immigrants | Costa Rica | 49.2 /100 | #175 | Average $85,054 |
| Alsatians | 49.2 /100 | #176 | Average $85,053 |
| Immigrants | Eritrea | 48.8 /100 | #177 | Average $85,025 |
| Czechoslovakians | 47.8 /100 | #178 | Average $84,965 |
| English | 47.0 /100 | #179 | Average $84,915 |