Immigrants from Philippines vs Slovene Disability
COMPARE
Immigrants from Philippines
Slovene
Disability
Disability Comparison
Immigrants from Philippines
Slovenes
11.3%
DISABILITY
94.6/ 100
METRIC RATING
115th/ 347
METRIC RANK
12.4%
DISABILITY
0.6/ 100
METRIC RATING
255th/ 347
METRIC RANK
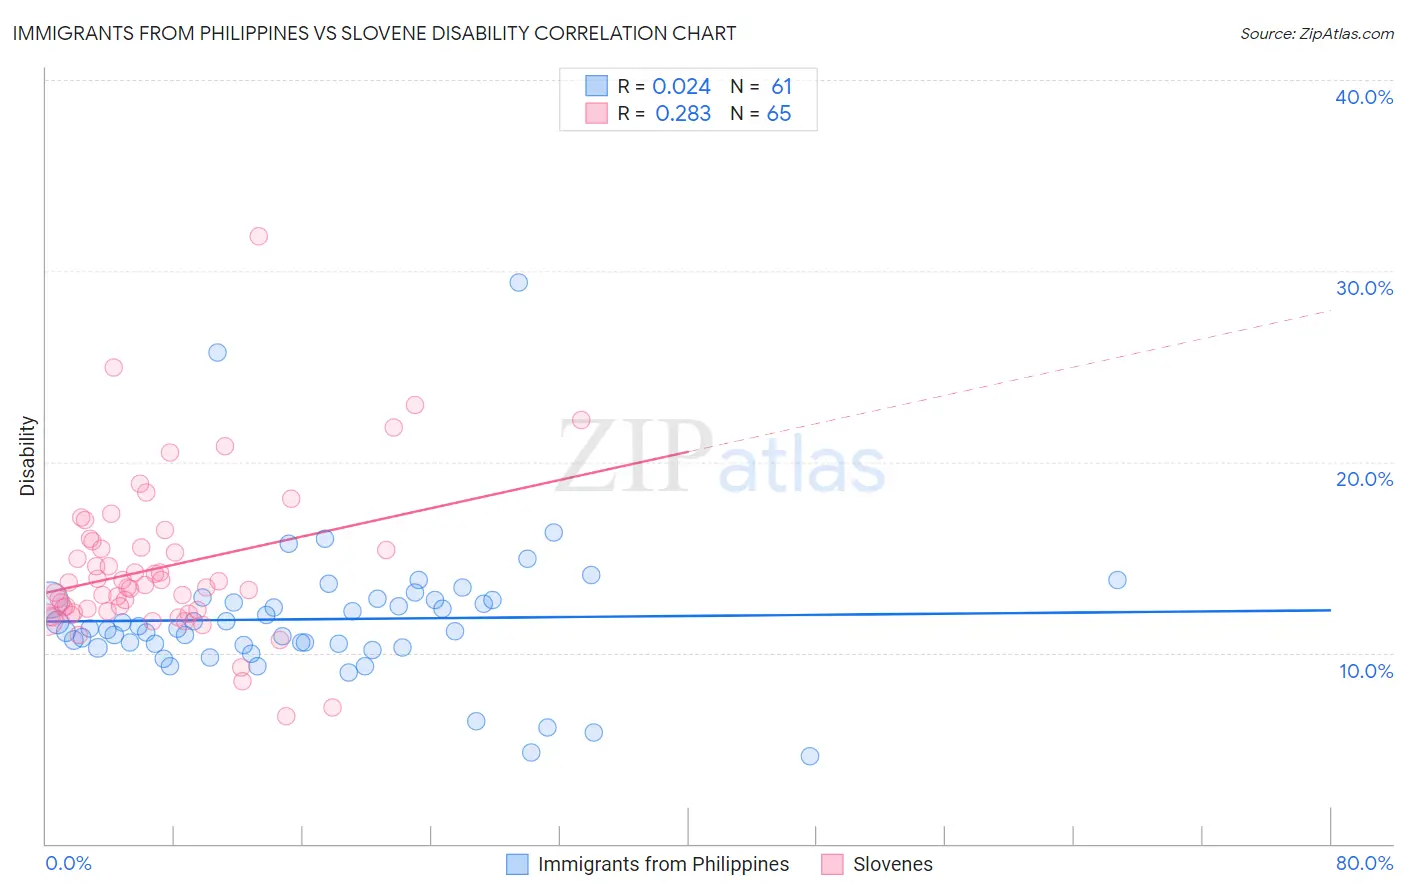
Immigrants from Philippines vs Slovene Disability Correlation Chart
The statistical analysis conducted on geographies consisting of 471,195,487 people shows no correlation between the proportion of Immigrants from Philippines and percentage of population with a disability in the United States with a correlation coefficient (R) of 0.024 and weighted average of 11.3%. Similarly, the statistical analysis conducted on geographies consisting of 261,350,851 people shows a weak positive correlation between the proportion of Slovenes and percentage of population with a disability in the United States with a correlation coefficient (R) of 0.283 and weighted average of 12.4%, a difference of 9.1%.
Disability Correlation Summary
| Measurement | Immigrants from Philippines | Slovene |
| Minimum | 4.6% | 6.7% |
| Maximum | 29.4% | 31.8% |
| Range | 24.8% | 25.1% |
| Mean | 11.8% | 14.5% |
| Median | 11.3% | 13.5% |
| Interquartile 25% (IQ1) | 10.4% | 12.1% |
| Interquartile 75% (IQ3) | 12.8% | 15.7% |
| Interquartile Range (IQR) | 2.4% | 3.6% |
| Standard Deviation (Sample) | 3.8% | 4.1% |
| Standard Deviation (Population) | 3.8% | 4.1% |
Similar Demographics by Disability
Demographics Similar to Immigrants from Philippines by Disability
In terms of disability, the demographic groups most similar to Immigrants from Philippines are Immigrants from Syria (11.3%, a difference of 0.010%), Guyanese (11.3%, a difference of 0.020%), Immigrants from Uzbekistan (11.3%, a difference of 0.060%), Immigrants from Northern Europe (11.3%, a difference of 0.11%), and Luxembourger (11.3%, a difference of 0.17%).
| Demographics | Rating | Rank | Disability |
| Immigrants | Nigeria | 96.0 /100 | #108 | Exceptional 11.3% |
| Immigrants | Uganda | 95.7 /100 | #109 | Exceptional 11.3% |
| Immigrants | Denmark | 95.6 /100 | #110 | Exceptional 11.3% |
| Immigrants | South Eastern Asia | 95.4 /100 | #111 | Exceptional 11.3% |
| Immigrants | Uzbekistan | 94.9 /100 | #112 | Exceptional 11.3% |
| Guyanese | 94.7 /100 | #113 | Exceptional 11.3% |
| Immigrants | Syria | 94.7 /100 | #114 | Exceptional 11.3% |
| Immigrants | Philippines | 94.6 /100 | #115 | Exceptional 11.3% |
| Immigrants | Northern Europe | 94.1 /100 | #116 | Exceptional 11.3% |
| Luxembourgers | 93.9 /100 | #117 | Exceptional 11.3% |
| Koreans | 93.8 /100 | #118 | Exceptional 11.3% |
| Central Americans | 93.5 /100 | #119 | Exceptional 11.4% |
| Immigrants | North Macedonia | 93.5 /100 | #120 | Exceptional 11.4% |
| Immigrants | Costa Rica | 93.4 /100 | #121 | Exceptional 11.4% |
| Brazilians | 93.3 /100 | #122 | Exceptional 11.4% |
Demographics Similar to Slovenes by Disability
In terms of disability, the demographic groups most similar to Slovenes are Immigrants from Dominica (12.4%, a difference of 0.070%), Immigrants from Laos (12.4%, a difference of 0.16%), Slavic (12.4%, a difference of 0.30%), German Russian (12.3%, a difference of 0.33%), and Belgian (12.3%, a difference of 0.35%).
| Demographics | Rating | Rank | Disability |
| Guamanians/Chamorros | 1.4 /100 | #248 | Tragic 12.3% |
| Carpatho Rusyns | 1.4 /100 | #249 | Tragic 12.3% |
| Sub-Saharan Africans | 1.4 /100 | #250 | Tragic 12.3% |
| Europeans | 1.4 /100 | #251 | Tragic 12.3% |
| Bermudans | 1.1 /100 | #252 | Tragic 12.3% |
| Belgians | 0.8 /100 | #253 | Tragic 12.3% |
| German Russians | 0.8 /100 | #254 | Tragic 12.3% |
| Slovenes | 0.6 /100 | #255 | Tragic 12.4% |
| Immigrants | Dominica | 0.6 /100 | #256 | Tragic 12.4% |
| Immigrants | Laos | 0.5 /100 | #257 | Tragic 12.4% |
| Slavs | 0.5 /100 | #258 | Tragic 12.4% |
| Canadians | 0.4 /100 | #259 | Tragic 12.4% |
| Immigrants | Liberia | 0.4 /100 | #260 | Tragic 12.4% |
| Scandinavians | 0.4 /100 | #261 | Tragic 12.4% |
| Native Hawaiians | 0.3 /100 | #262 | Tragic 12.5% |