Immigrants from Cabo Verde vs Pueblo Disability Age 5 to 17
COMPARE
Immigrants from Cabo Verde
Pueblo
Disability Age 5 to 17
Disability Age 5 to 17 Comparison
Immigrants from Cabo Verde
Pueblo
7.1%
DISABILITY AGE 5 TO 17
0.0/ 100
METRIC RATING
343rd/ 347
METRIC RANK
5.7%
DISABILITY AGE 5 TO 17
27.5/ 100
METRIC RATING
189th/ 347
METRIC RANK
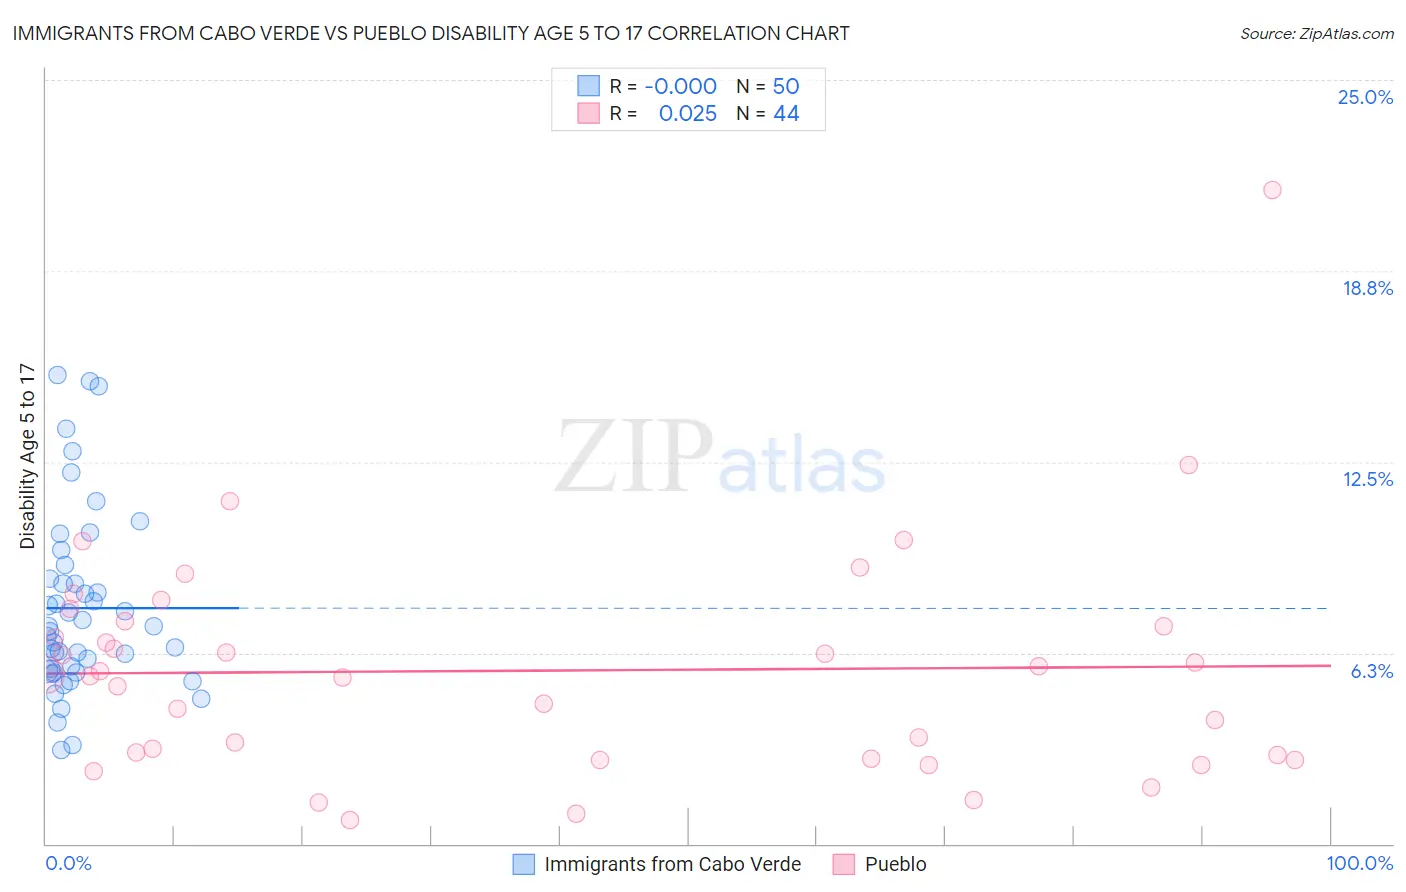
Immigrants from Cabo Verde vs Pueblo Disability Age 5 to 17 Correlation Chart
The statistical analysis conducted on geographies consisting of 38,075,511 people shows no correlation between the proportion of Immigrants from Cabo Verde and percentage of population with a disability between the ages 5 and 17 in the United States with a correlation coefficient (R) of -0.000 and weighted average of 7.1%. Similarly, the statistical analysis conducted on geographies consisting of 119,704,648 people shows no correlation between the proportion of Pueblo and percentage of population with a disability between the ages 5 and 17 in the United States with a correlation coefficient (R) of 0.025 and weighted average of 5.7%, a difference of 25.9%.
Disability Age 5 to 17 Correlation Summary
| Measurement | Immigrants from Cabo Verde | Pueblo |
| Minimum | 3.1% | 0.78% |
| Maximum | 15.3% | 21.4% |
| Range | 12.3% | 20.6% |
| Mean | 7.7% | 5.7% |
| Median | 7.0% | 5.5% |
| Interquartile 25% (IQ1) | 5.7% | 2.8% |
| Interquartile 75% (IQ3) | 8.7% | 7.2% |
| Interquartile Range (IQR) | 3.0% | 4.3% |
| Standard Deviation (Sample) | 3.0% | 3.7% |
| Standard Deviation (Population) | 2.9% | 3.7% |
Similar Demographics by Disability Age 5 to 17
Demographics Similar to Immigrants from Cabo Verde by Disability Age 5 to 17
In terms of disability age 5 to 17, the demographic groups most similar to Immigrants from Cabo Verde are Chippewa (7.1%, a difference of 0.26%), Cajun (7.2%, a difference of 0.70%), Cape Verdean (7.0%, a difference of 2.4%), Cherokee (6.9%, a difference of 3.0%), and Choctaw (6.9%, a difference of 3.3%).
| Demographics | Rating | Rank | Disability Age 5 to 17 |
| Blacks/African Americans | 0.0 /100 | #333 | Tragic 6.8% |
| Seminole | 0.0 /100 | #334 | Tragic 6.8% |
| Ottawa | 0.0 /100 | #335 | Tragic 6.8% |
| Chickasaw | 0.0 /100 | #336 | Tragic 6.8% |
| Creek | 0.0 /100 | #337 | Tragic 6.9% |
| Iroquois | 0.0 /100 | #338 | Tragic 6.9% |
| Choctaw | 0.0 /100 | #339 | Tragic 6.9% |
| Cherokee | 0.0 /100 | #340 | Tragic 6.9% |
| Cape Verdeans | 0.0 /100 | #341 | Tragic 7.0% |
| Chippewa | 0.0 /100 | #342 | Tragic 7.1% |
| Immigrants | Cabo Verde | 0.0 /100 | #343 | Tragic 7.1% |
| Cajuns | 0.0 /100 | #344 | Tragic 7.2% |
| Tsimshian | 0.0 /100 | #345 | Tragic 7.9% |
| Puerto Ricans | 0.0 /100 | #346 | Tragic 8.3% |
| Houma | 0.0 /100 | #347 | Tragic 9.1% |
Demographics Similar to Pueblo by Disability Age 5 to 17
In terms of disability age 5 to 17, the demographic groups most similar to Pueblo are Immigrants from Eastern Africa (5.7%, a difference of 0.010%), Marshallese (5.7%, a difference of 0.040%), Danish (5.7%, a difference of 0.060%), Immigrants from Bosnia and Herzegovina (5.7%, a difference of 0.070%), and Immigrants from Canada (5.7%, a difference of 0.090%).
| Demographics | Rating | Rank | Disability Age 5 to 17 |
| Mexican American Indians | 35.2 /100 | #182 | Fair 5.6% |
| Immigrants | Latin America | 34.3 /100 | #183 | Fair 5.6% |
| Syrians | 33.8 /100 | #184 | Fair 5.6% |
| Immigrants | Mexico | 33.7 /100 | #185 | Fair 5.6% |
| Fijians | 31.7 /100 | #186 | Fair 5.7% |
| Immigrants | Thailand | 30.2 /100 | #187 | Fair 5.7% |
| Marshallese | 28.1 /100 | #188 | Fair 5.7% |
| Pueblo | 27.5 /100 | #189 | Fair 5.7% |
| Immigrants | Eastern Africa | 27.3 /100 | #190 | Fair 5.7% |
| Danes | 26.5 /100 | #191 | Fair 5.7% |
| Immigrants | Bosnia and Herzegovina | 26.3 /100 | #192 | Fair 5.7% |
| Immigrants | Canada | 26.1 /100 | #193 | Fair 5.7% |
| Croatians | 23.6 /100 | #194 | Fair 5.7% |
| Immigrants | Nigeria | 23.4 /100 | #195 | Fair 5.7% |
| Inupiat | 23.3 /100 | #196 | Fair 5.7% |