Immigrants from Cameroon vs Pueblo Disability Age 5 to 17
COMPARE
Immigrants from Cameroon
Pueblo
Disability Age 5 to 17
Disability Age 5 to 17 Comparison
Immigrants from Cameroon
Pueblo
5.8%
DISABILITY AGE 5 TO 17
8.3/ 100
METRIC RATING
213th/ 347
METRIC RANK
5.7%
DISABILITY AGE 5 TO 17
27.5/ 100
METRIC RATING
189th/ 347
METRIC RANK
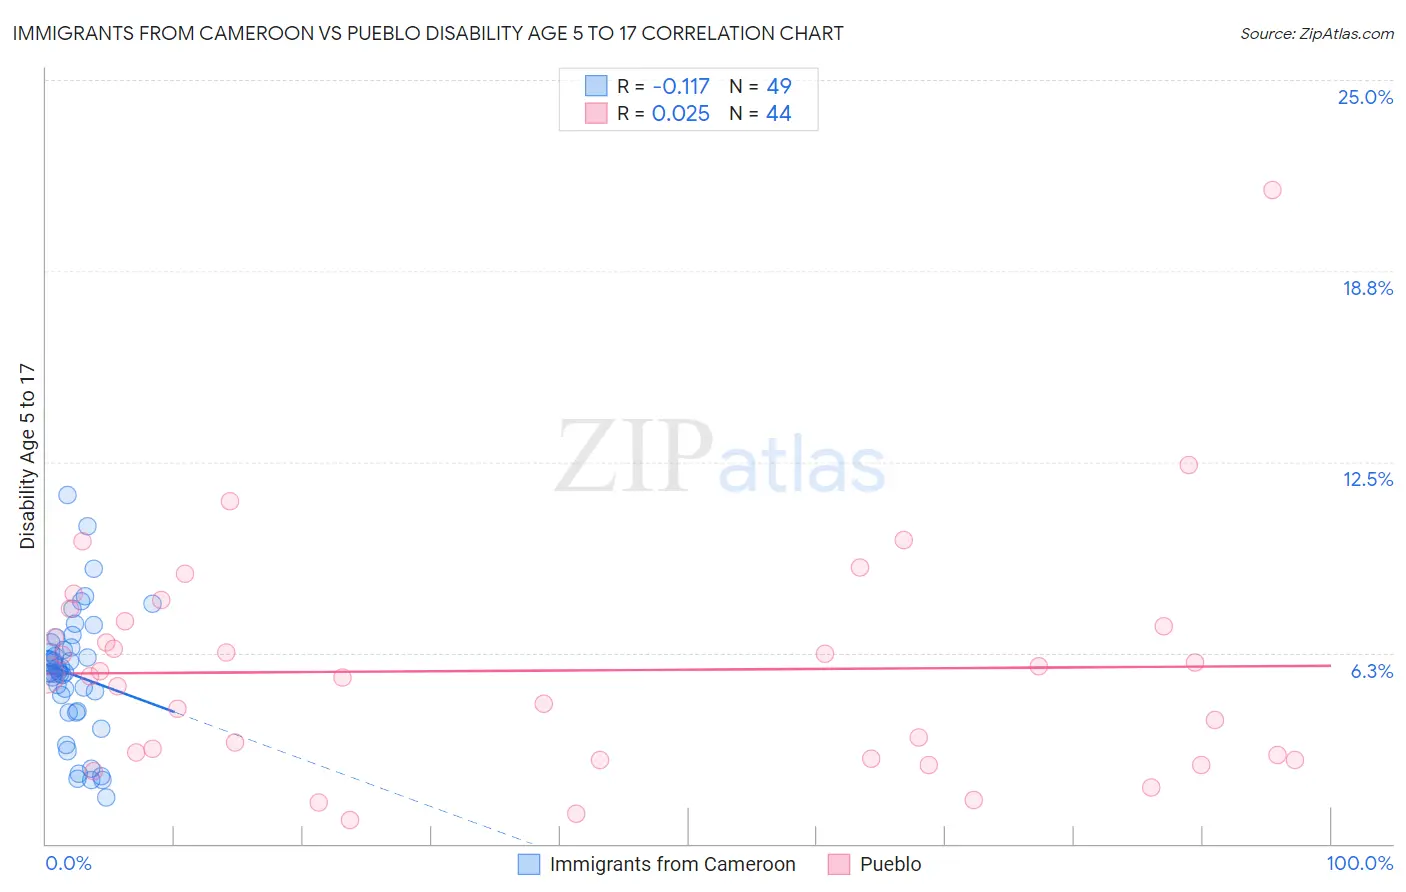
Immigrants from Cameroon vs Pueblo Disability Age 5 to 17 Correlation Chart
The statistical analysis conducted on geographies consisting of 130,401,709 people shows a poor negative correlation between the proportion of Immigrants from Cameroon and percentage of population with a disability between the ages 5 and 17 in the United States with a correlation coefficient (R) of -0.117 and weighted average of 5.8%. Similarly, the statistical analysis conducted on geographies consisting of 119,704,648 people shows no correlation between the proportion of Pueblo and percentage of population with a disability between the ages 5 and 17 in the United States with a correlation coefficient (R) of 0.025 and weighted average of 5.7%, a difference of 1.7%.
Disability Age 5 to 17 Correlation Summary
| Measurement | Immigrants from Cameroon | Pueblo |
| Minimum | 1.5% | 0.78% |
| Maximum | 11.4% | 21.4% |
| Range | 9.9% | 20.6% |
| Mean | 5.5% | 5.7% |
| Median | 5.6% | 5.5% |
| Interquartile 25% (IQ1) | 4.3% | 2.8% |
| Interquartile 75% (IQ3) | 6.5% | 7.2% |
| Interquartile Range (IQR) | 2.2% | 4.3% |
| Standard Deviation (Sample) | 2.1% | 3.7% |
| Standard Deviation (Population) | 2.1% | 3.7% |
Similar Demographics by Disability Age 5 to 17
Demographics Similar to Immigrants from Cameroon by Disability Age 5 to 17
In terms of disability age 5 to 17, the demographic groups most similar to Immigrants from Cameroon are Immigrants from Morocco (5.8%, a difference of 0.0%), Swedish (5.8%, a difference of 0.040%), Immigrants from Panama (5.8%, a difference of 0.050%), Yugoslavian (5.8%, a difference of 0.12%), and Nigerian (5.8%, a difference of 0.13%).
| Demographics | Rating | Rank | Disability Age 5 to 17 |
| Immigrants | Africa | 10.8 /100 | #206 | Poor 5.7% |
| Moroccans | 10.4 /100 | #207 | Poor 5.7% |
| Kenyans | 10.0 /100 | #208 | Poor 5.8% |
| Immigrants | Uganda | 9.7 /100 | #209 | Tragic 5.8% |
| Immigrants | Haiti | 9.5 /100 | #210 | Tragic 5.8% |
| Yugoslavians | 9.1 /100 | #211 | Tragic 5.8% |
| Immigrants | Panama | 8.7 /100 | #212 | Tragic 5.8% |
| Immigrants | Cameroon | 8.3 /100 | #213 | Tragic 5.8% |
| Immigrants | Morocco | 8.3 /100 | #214 | Tragic 5.8% |
| Swedes | 8.1 /100 | #215 | Tragic 5.8% |
| Nigerians | 7.5 /100 | #216 | Tragic 5.8% |
| Czechs | 7.4 /100 | #217 | Tragic 5.8% |
| Immigrants | Sierra Leone | 7.1 /100 | #218 | Tragic 5.8% |
| Sierra Leoneans | 7.0 /100 | #219 | Tragic 5.8% |
| Belgians | 6.9 /100 | #220 | Tragic 5.8% |
Demographics Similar to Pueblo by Disability Age 5 to 17
In terms of disability age 5 to 17, the demographic groups most similar to Pueblo are Immigrants from Eastern Africa (5.7%, a difference of 0.010%), Marshallese (5.7%, a difference of 0.040%), Danish (5.7%, a difference of 0.060%), Immigrants from Bosnia and Herzegovina (5.7%, a difference of 0.070%), and Immigrants from Canada (5.7%, a difference of 0.090%).
| Demographics | Rating | Rank | Disability Age 5 to 17 |
| Mexican American Indians | 35.2 /100 | #182 | Fair 5.6% |
| Immigrants | Latin America | 34.3 /100 | #183 | Fair 5.6% |
| Syrians | 33.8 /100 | #184 | Fair 5.6% |
| Immigrants | Mexico | 33.7 /100 | #185 | Fair 5.6% |
| Fijians | 31.7 /100 | #186 | Fair 5.7% |
| Immigrants | Thailand | 30.2 /100 | #187 | Fair 5.7% |
| Marshallese | 28.1 /100 | #188 | Fair 5.7% |
| Pueblo | 27.5 /100 | #189 | Fair 5.7% |
| Immigrants | Eastern Africa | 27.3 /100 | #190 | Fair 5.7% |
| Danes | 26.5 /100 | #191 | Fair 5.7% |
| Immigrants | Bosnia and Herzegovina | 26.3 /100 | #192 | Fair 5.7% |
| Immigrants | Canada | 26.1 /100 | #193 | Fair 5.7% |
| Croatians | 23.6 /100 | #194 | Fair 5.7% |
| Immigrants | Nigeria | 23.4 /100 | #195 | Fair 5.7% |
| Inupiat | 23.3 /100 | #196 | Fair 5.7% |