Immigrants from Western Asia vs Kiowa Disability Age 5 to 17
COMPARE
Immigrants from Western Asia
Kiowa
Disability Age 5 to 17
Disability Age 5 to 17 Comparison
Immigrants from Western Asia
Kiowa
5.1%
DISABILITY AGE 5 TO 17
100.0/ 100
METRIC RATING
49th/ 347
METRIC RANK
6.4%
DISABILITY AGE 5 TO 17
0.0/ 100
METRIC RATING
317th/ 347
METRIC RANK
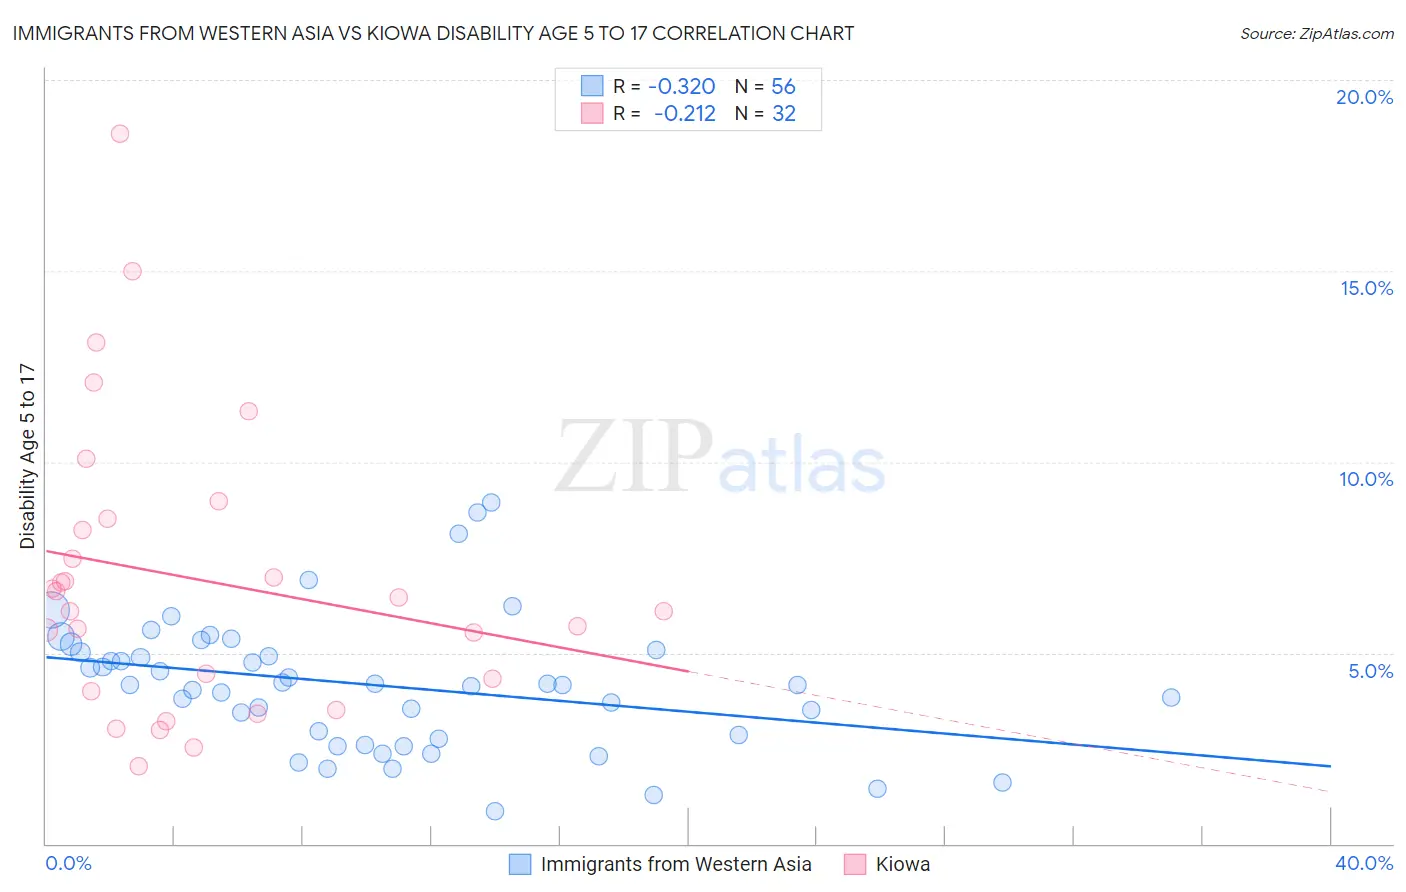
Immigrants from Western Asia vs Kiowa Disability Age 5 to 17 Correlation Chart
The statistical analysis conducted on geographies consisting of 400,987,262 people shows a mild negative correlation between the proportion of Immigrants from Western Asia and percentage of population with a disability between the ages 5 and 17 in the United States with a correlation coefficient (R) of -0.320 and weighted average of 5.1%. Similarly, the statistical analysis conducted on geographies consisting of 55,978,349 people shows a weak negative correlation between the proportion of Kiowa and percentage of population with a disability between the ages 5 and 17 in the United States with a correlation coefficient (R) of -0.212 and weighted average of 6.4%, a difference of 27.2%.
Disability Age 5 to 17 Correlation Summary
| Measurement | Immigrants from Western Asia | Kiowa |
| Minimum | 0.84% | 2.0% |
| Maximum | 8.9% | 18.6% |
| Range | 8.1% | 16.6% |
| Mean | 4.2% | 6.9% |
| Median | 4.2% | 6.3% |
| Interquartile 25% (IQ1) | 2.8% | 4.2% |
| Interquartile 75% (IQ3) | 5.0% | 8.4% |
| Interquartile Range (IQR) | 2.2% | 4.2% |
| Standard Deviation (Sample) | 1.7% | 3.8% |
| Standard Deviation (Population) | 1.7% | 3.7% |
Similar Demographics by Disability Age 5 to 17
Demographics Similar to Immigrants from Western Asia by Disability Age 5 to 17
In terms of disability age 5 to 17, the demographic groups most similar to Immigrants from Western Asia are Korean (5.1%, a difference of 0.080%), Vietnamese (5.1%, a difference of 0.27%), Assyrian/Chaldean/Syriac (5.0%, a difference of 0.39%), Argentinean (5.1%, a difference of 0.41%), and Tongan (5.0%, a difference of 0.46%).
| Demographics | Rating | Rank | Disability Age 5 to 17 |
| Immigrants | Sri Lanka | 100.0 /100 | #42 | Exceptional 5.0% |
| Immigrants | Russia | 100.0 /100 | #43 | Exceptional 5.0% |
| Egyptians | 100.0 /100 | #44 | Exceptional 5.0% |
| Tongans | 100.0 /100 | #45 | Exceptional 5.0% |
| Assyrians/Chaldeans/Syriacs | 100.0 /100 | #46 | Exceptional 5.0% |
| Vietnamese | 100.0 /100 | #47 | Exceptional 5.1% |
| Koreans | 100.0 /100 | #48 | Exceptional 5.1% |
| Immigrants | Western Asia | 100.0 /100 | #49 | Exceptional 5.1% |
| Argentineans | 99.9 /100 | #50 | Exceptional 5.1% |
| Turks | 99.9 /100 | #51 | Exceptional 5.1% |
| Immigrants | Fiji | 99.9 /100 | #52 | Exceptional 5.1% |
| Immigrants | Lithuania | 99.9 /100 | #53 | Exceptional 5.1% |
| Paraguayans | 99.9 /100 | #54 | Exceptional 5.1% |
| Laotians | 99.9 /100 | #55 | Exceptional 5.1% |
| Immigrants | Turkey | 99.9 /100 | #56 | Exceptional 5.1% |
Demographics Similar to Kiowa by Disability Age 5 to 17
In terms of disability age 5 to 17, the demographic groups most similar to Kiowa are Comanche (6.4%, a difference of 0.030%), Immigrants from Dominican Republic (6.4%, a difference of 0.13%), Immigrants from Portugal (6.4%, a difference of 0.31%), French (6.4%, a difference of 0.48%), and Delaware (6.5%, a difference of 0.58%).
| Demographics | Rating | Rank | Disability Age 5 to 17 |
| Alaskan Athabascans | 0.0 /100 | #310 | Tragic 6.3% |
| Immigrants | Dominica | 0.0 /100 | #311 | Tragic 6.3% |
| Bermudans | 0.0 /100 | #312 | Tragic 6.4% |
| Apache | 0.0 /100 | #313 | Tragic 6.4% |
| French | 0.0 /100 | #314 | Tragic 6.4% |
| Immigrants | Portugal | 0.0 /100 | #315 | Tragic 6.4% |
| Immigrants | Dominican Republic | 0.0 /100 | #316 | Tragic 6.4% |
| Kiowa | 0.0 /100 | #317 | Tragic 6.4% |
| Comanche | 0.0 /100 | #318 | Tragic 6.4% |
| Delaware | 0.0 /100 | #319 | Tragic 6.5% |
| Africans | 0.0 /100 | #320 | Tragic 6.5% |
| Tohono O'odham | 0.0 /100 | #321 | Tragic 6.5% |
| Slovaks | 0.0 /100 | #322 | Tragic 6.5% |
| Osage | 0.0 /100 | #323 | Tragic 6.5% |
| Dominicans | 0.0 /100 | #324 | Tragic 6.5% |