Sudanese vs Immigrants from Liberia Vision Disability
COMPARE
Sudanese
Immigrants from Liberia
Vision Disability
Vision Disability Comparison
Sudanese
Immigrants from Liberia
2.1%
VISION DISABILITY
89.2/ 100
METRIC RATING
127th/ 347
METRIC RANK
2.4%
VISION DISABILITY
0.1/ 100
METRIC RATING
264th/ 347
METRIC RANK
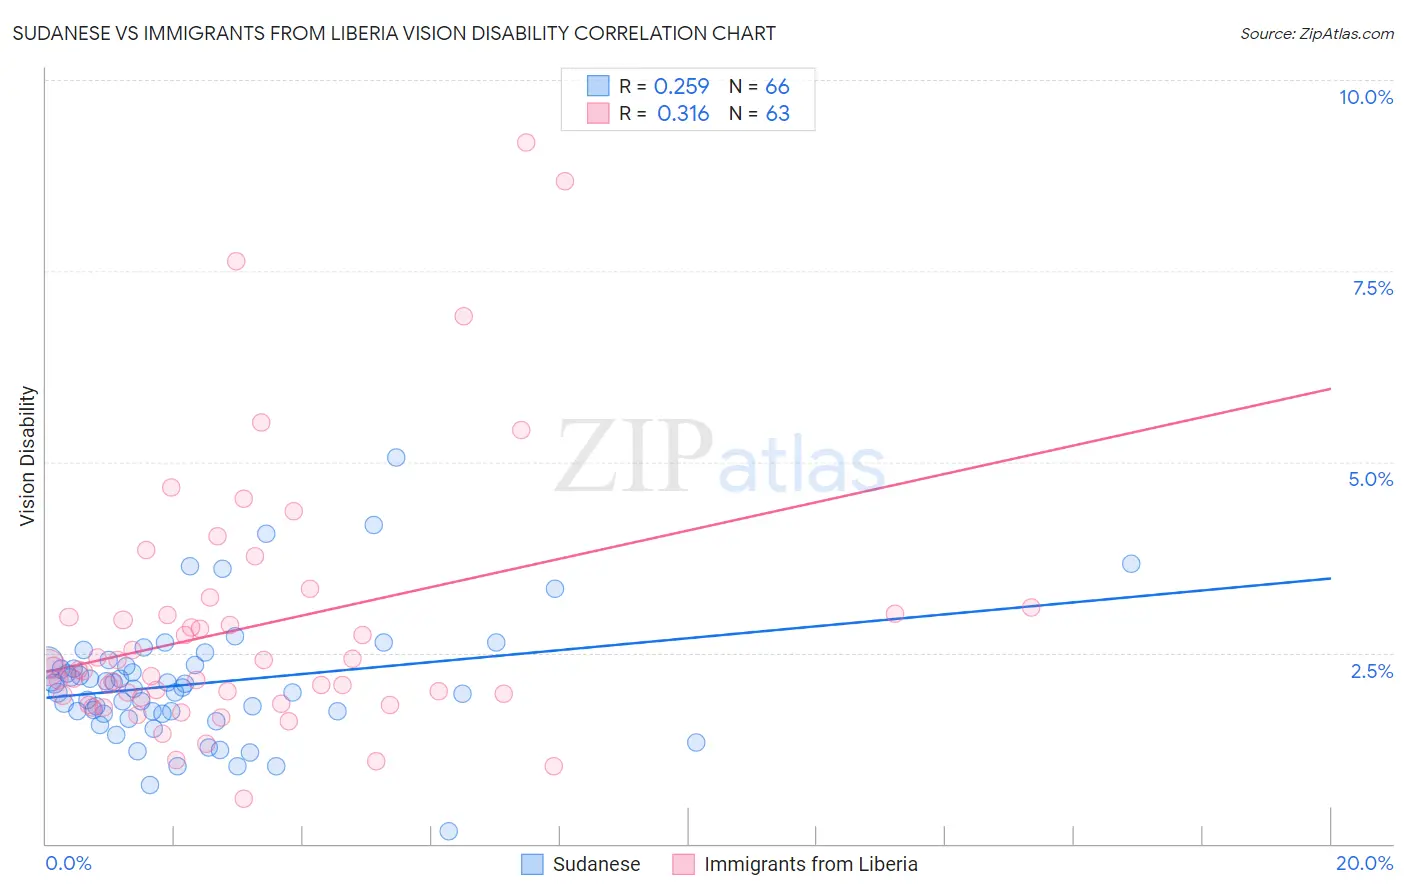
Sudanese vs Immigrants from Liberia Vision Disability Correlation Chart
The statistical analysis conducted on geographies consisting of 110,115,679 people shows a weak positive correlation between the proportion of Sudanese and percentage of population with vision disability in the United States with a correlation coefficient (R) of 0.259 and weighted average of 2.1%. Similarly, the statistical analysis conducted on geographies consisting of 135,226,423 people shows a mild positive correlation between the proportion of Immigrants from Liberia and percentage of population with vision disability in the United States with a correlation coefficient (R) of 0.316 and weighted average of 2.4%, a difference of 14.5%.
Vision Disability Correlation Summary
| Measurement | Sudanese | Immigrants from Liberia |
| Minimum | 0.17% | 0.59% |
| Maximum | 5.1% | 9.2% |
| Range | 4.9% | 8.6% |
| Mean | 2.1% | 2.8% |
| Median | 2.0% | 2.3% |
| Interquartile 25% (IQ1) | 1.7% | 1.9% |
| Interquartile 75% (IQ3) | 2.3% | 3.0% |
| Interquartile Range (IQR) | 0.64% | 1.1% |
| Standard Deviation (Sample) | 0.82% | 1.7% |
| Standard Deviation (Population) | 0.81% | 1.7% |
Similar Demographics by Vision Disability
Demographics Similar to Sudanese by Vision Disability
In terms of vision disability, the demographic groups most similar to Sudanese are Immigrants from Chile (2.1%, a difference of 0.030%), Immigrants from Peru (2.1%, a difference of 0.060%), Immigrants from Cameroon (2.1%, a difference of 0.070%), Immigrants from Kenya (2.1%, a difference of 0.070%), and Immigrants from Hungary (2.1%, a difference of 0.090%).
| Demographics | Rating | Rank | Vision Disability |
| Immigrants | Zimbabwe | 91.0 /100 | #120 | Exceptional 2.1% |
| Immigrants | Scotland | 90.4 /100 | #121 | Exceptional 2.1% |
| Immigrants | Ukraine | 90.4 /100 | #122 | Exceptional 2.1% |
| Immigrants | Albania | 90.4 /100 | #123 | Exceptional 2.1% |
| Immigrants | Spain | 89.8 /100 | #124 | Excellent 2.1% |
| Immigrants | Venezuela | 89.8 /100 | #125 | Excellent 2.1% |
| Immigrants | Peru | 89.5 /100 | #126 | Excellent 2.1% |
| Sudanese | 89.2 /100 | #127 | Excellent 2.1% |
| Immigrants | Chile | 89.0 /100 | #128 | Excellent 2.1% |
| Immigrants | Cameroon | 88.8 /100 | #129 | Excellent 2.1% |
| Immigrants | Kenya | 88.7 /100 | #130 | Excellent 2.1% |
| Immigrants | Hungary | 88.7 /100 | #131 | Excellent 2.1% |
| New Zealanders | 88.2 /100 | #132 | Excellent 2.1% |
| Syrians | 87.5 /100 | #133 | Excellent 2.1% |
| Venezuelans | 87.2 /100 | #134 | Excellent 2.1% |
Demographics Similar to Immigrants from Liberia by Vision Disability
In terms of vision disability, the demographic groups most similar to Immigrants from Liberia are Immigrants from Jamaica (2.4%, a difference of 0.020%), Mexican American Indian (2.4%, a difference of 0.070%), Ute (2.4%, a difference of 0.080%), Immigrants from Belize (2.4%, a difference of 0.12%), and Senegalese (2.4%, a difference of 0.16%).
| Demographics | Rating | Rank | Vision Disability |
| West Indians | 0.2 /100 | #257 | Tragic 2.4% |
| British West Indians | 0.2 /100 | #258 | Tragic 2.4% |
| Whites/Caucasians | 0.2 /100 | #259 | Tragic 2.4% |
| Belizeans | 0.2 /100 | #260 | Tragic 2.4% |
| Fijians | 0.1 /100 | #261 | Tragic 2.4% |
| Jamaicans | 0.1 /100 | #262 | Tragic 2.4% |
| Immigrants | Belize | 0.1 /100 | #263 | Tragic 2.4% |
| Immigrants | Liberia | 0.1 /100 | #264 | Tragic 2.4% |
| Immigrants | Jamaica | 0.1 /100 | #265 | Tragic 2.4% |
| Mexican American Indians | 0.1 /100 | #266 | Tragic 2.4% |
| Ute | 0.1 /100 | #267 | Tragic 2.4% |
| Senegalese | 0.1 /100 | #268 | Tragic 2.4% |
| Celtics | 0.1 /100 | #269 | Tragic 2.4% |
| Cubans | 0.1 /100 | #270 | Tragic 2.4% |
| Immigrants | Azores | 0.1 /100 | #271 | Tragic 2.4% |