Cherokee vs Immigrants from Latin America Vision Disability
COMPARE
Cherokee
Immigrants from Latin America
Vision Disability
Vision Disability Comparison
Cherokee
Immigrants from Latin America
2.9%
VISION DISABILITY
0.0/ 100
METRIC RATING
325th/ 347
METRIC RANK
2.4%
VISION DISABILITY
0.0/ 100
METRIC RATING
274th/ 347
METRIC RANK
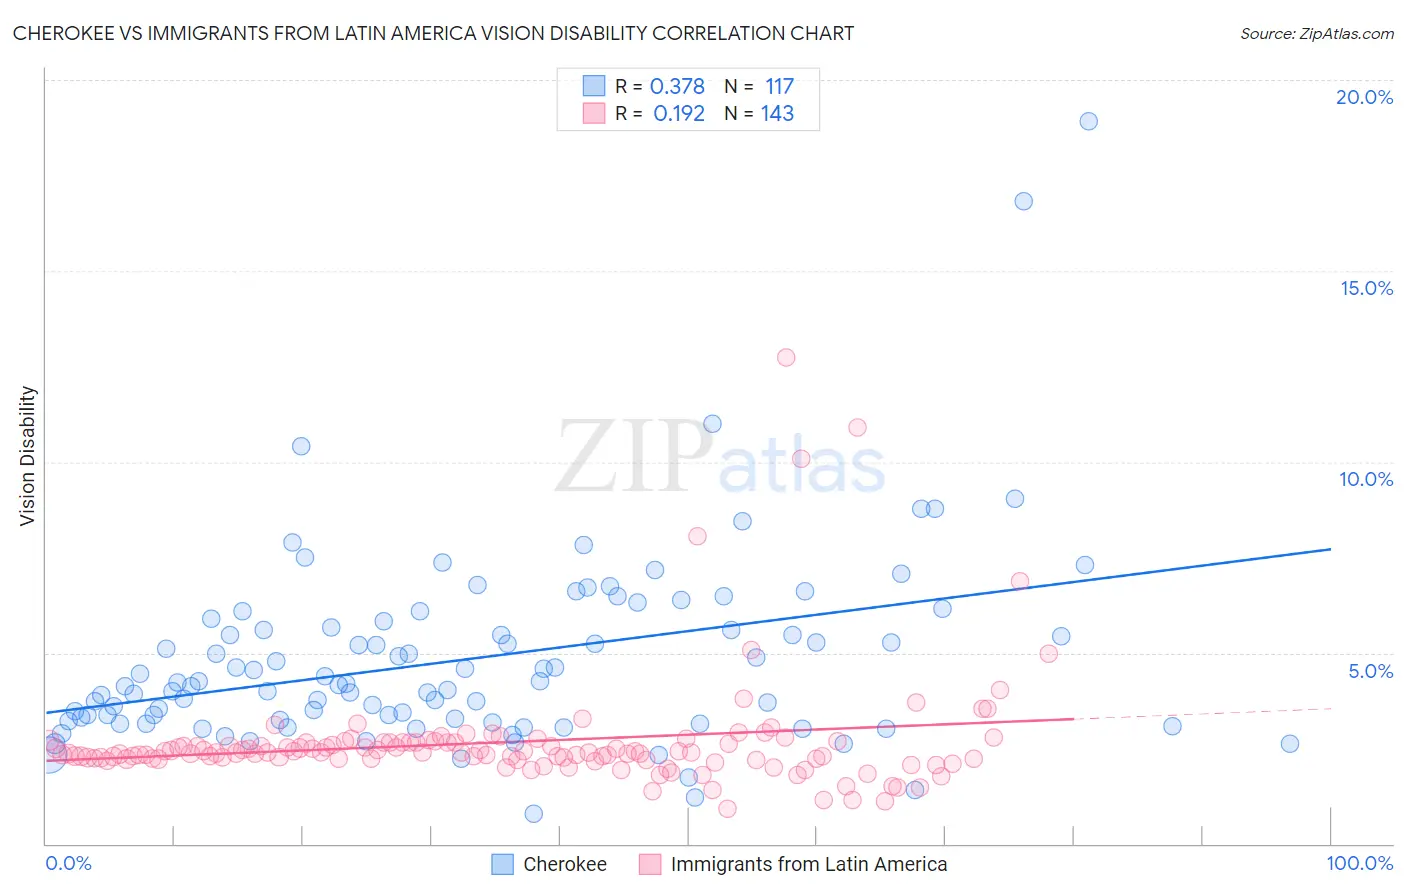
Cherokee vs Immigrants from Latin America Vision Disability Correlation Chart
The statistical analysis conducted on geographies consisting of 493,069,891 people shows a mild positive correlation between the proportion of Cherokee and percentage of population with vision disability in the United States with a correlation coefficient (R) of 0.378 and weighted average of 2.9%. Similarly, the statistical analysis conducted on geographies consisting of 557,074,297 people shows a poor positive correlation between the proportion of Immigrants from Latin America and percentage of population with vision disability in the United States with a correlation coefficient (R) of 0.192 and weighted average of 2.4%, a difference of 19.8%.
Vision Disability Correlation Summary
| Measurement | Cherokee | Immigrants from Latin America |
| Minimum | 0.78% | 0.90% |
| Maximum | 18.9% | 12.7% |
| Range | 18.1% | 11.8% |
| Mean | 4.8% | 2.7% |
| Median | 4.2% | 2.4% |
| Interquartile 25% (IQ1) | 3.2% | 2.2% |
| Interquartile 75% (IQ3) | 5.8% | 2.7% |
| Interquartile Range (IQR) | 2.5% | 0.43% |
| Standard Deviation (Sample) | 2.5% | 1.5% |
| Standard Deviation (Population) | 2.5% | 1.5% |
Similar Demographics by Vision Disability
Demographics Similar to Cherokee by Vision Disability
In terms of vision disability, the demographic groups most similar to Cherokee are Hopi (2.9%, a difference of 0.010%), Spanish American (2.9%, a difference of 1.2%), Native/Alaskan (3.0%, a difference of 2.0%), Tlingit-Haida (2.9%, a difference of 2.0%), and Paiute (2.9%, a difference of 2.0%).
| Demographics | Rating | Rank | Vision Disability |
| Alaska Natives | 0.0 /100 | #318 | Tragic 2.7% |
| Tohono O'odham | 0.0 /100 | #319 | Tragic 2.8% |
| Blacks/African Americans | 0.0 /100 | #320 | Tragic 2.8% |
| Comanche | 0.0 /100 | #321 | Tragic 2.8% |
| Paiute | 0.0 /100 | #322 | Tragic 2.9% |
| Tlingit-Haida | 0.0 /100 | #323 | Tragic 2.9% |
| Hopi | 0.0 /100 | #324 | Tragic 2.9% |
| Cherokee | 0.0 /100 | #325 | Tragic 2.9% |
| Spanish Americans | 0.0 /100 | #326 | Tragic 2.9% |
| Natives/Alaskans | 0.0 /100 | #327 | Tragic 3.0% |
| Yuman | 0.0 /100 | #328 | Tragic 3.0% |
| Apache | 0.0 /100 | #329 | Tragic 3.0% |
| Colville | 0.0 /100 | #330 | Tragic 3.0% |
| Central American Indians | 0.0 /100 | #331 | Tragic 3.0% |
| Seminole | 0.0 /100 | #332 | Tragic 3.1% |
Demographics Similar to Immigrants from Latin America by Vision Disability
In terms of vision disability, the demographic groups most similar to Immigrants from Latin America are Immigrants from Bahamas (2.4%, a difference of 0.31%), Chippewa (2.4%, a difference of 0.32%), Scotch-Irish (2.4%, a difference of 0.41%), Bahamian (2.4%, a difference of 0.45%), and Spanish (2.4%, a difference of 0.61%).
| Demographics | Rating | Rank | Vision Disability |
| Ute | 0.1 /100 | #267 | Tragic 2.4% |
| Senegalese | 0.1 /100 | #268 | Tragic 2.4% |
| Celtics | 0.1 /100 | #269 | Tragic 2.4% |
| Cubans | 0.1 /100 | #270 | Tragic 2.4% |
| Immigrants | Azores | 0.1 /100 | #271 | Tragic 2.4% |
| Spaniards | 0.1 /100 | #272 | Tragic 2.4% |
| Immigrants | Bahamas | 0.1 /100 | #273 | Tragic 2.4% |
| Immigrants | Latin America | 0.0 /100 | #274 | Tragic 2.4% |
| Chippewa | 0.0 /100 | #275 | Tragic 2.4% |
| Scotch-Irish | 0.0 /100 | #276 | Tragic 2.4% |
| Bahamians | 0.0 /100 | #277 | Tragic 2.4% |
| Spanish | 0.0 /100 | #278 | Tragic 2.4% |
| Nepalese | 0.0 /100 | #279 | Tragic 2.4% |
| Cape Verdeans | 0.0 /100 | #280 | Tragic 2.4% |
| U.S. Virgin Islanders | 0.0 /100 | #281 | Tragic 2.5% |