Sudanese vs Immigrants from Ireland Vision Disability
COMPARE
Sudanese
Immigrants from Ireland
Vision Disability
Vision Disability Comparison
Sudanese
Immigrants from Ireland
2.1%
VISION DISABILITY
89.2/ 100
METRIC RATING
127th/ 347
METRIC RANK
2.0%
VISION DISABILITY
99.7/ 100
METRIC RATING
40th/ 347
METRIC RANK
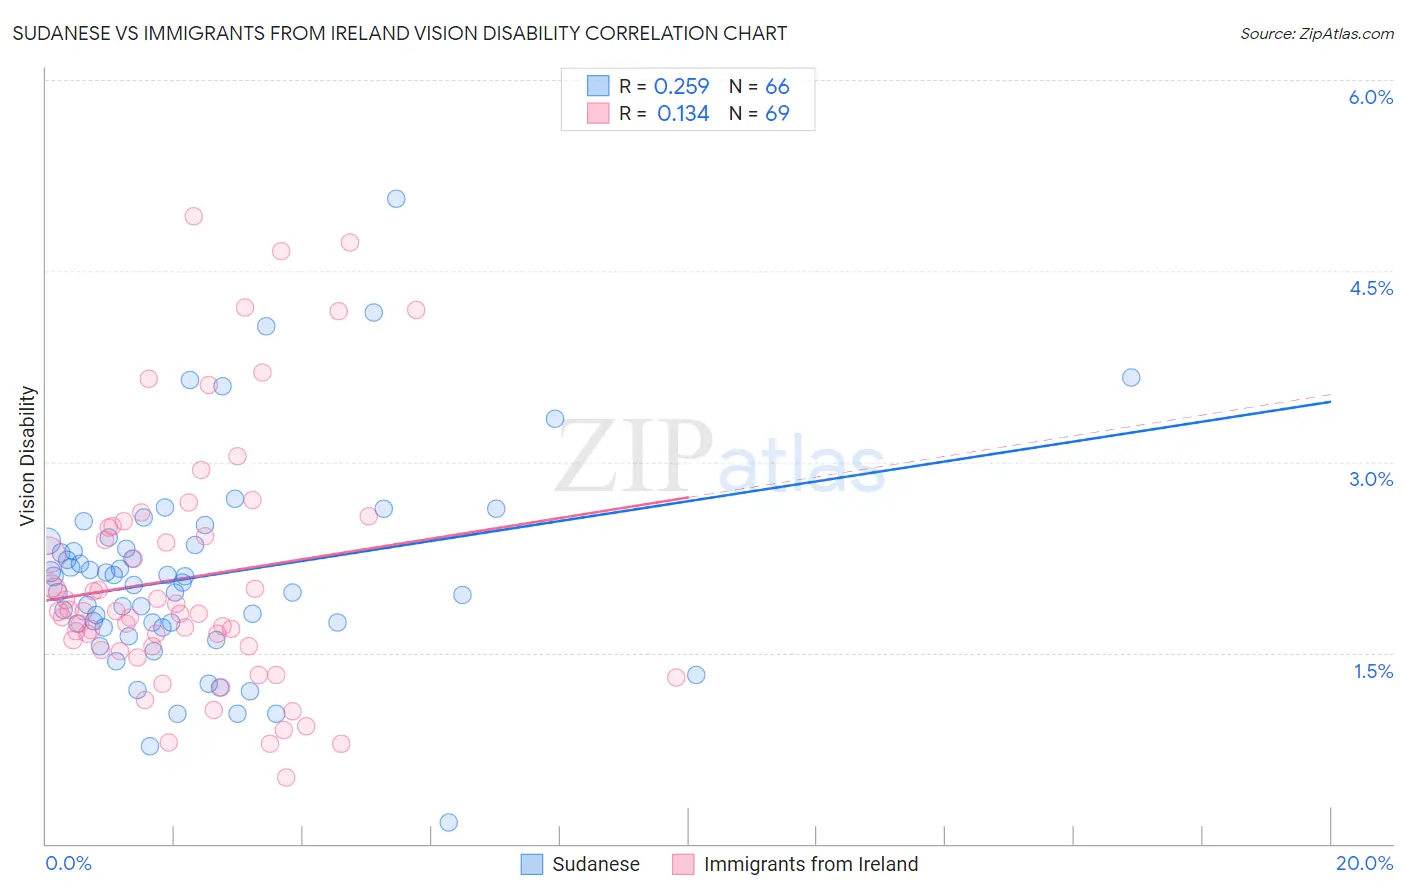
Sudanese vs Immigrants from Ireland Vision Disability Correlation Chart
The statistical analysis conducted on geographies consisting of 110,115,679 people shows a weak positive correlation between the proportion of Sudanese and percentage of population with vision disability in the United States with a correlation coefficient (R) of 0.259 and weighted average of 2.1%. Similarly, the statistical analysis conducted on geographies consisting of 240,640,938 people shows a poor positive correlation between the proportion of Immigrants from Ireland and percentage of population with vision disability in the United States with a correlation coefficient (R) of 0.134 and weighted average of 2.0%, a difference of 6.5%.
Vision Disability Correlation Summary
| Measurement | Sudanese | Immigrants from Ireland |
| Minimum | 0.17% | 0.52% |
| Maximum | 5.1% | 4.9% |
| Range | 4.9% | 4.4% |
| Mean | 2.1% | 2.1% |
| Median | 2.0% | 1.8% |
| Interquartile 25% (IQ1) | 1.7% | 1.5% |
| Interquartile 75% (IQ3) | 2.3% | 2.5% |
| Interquartile Range (IQR) | 0.64% | 0.95% |
| Standard Deviation (Sample) | 0.82% | 0.99% |
| Standard Deviation (Population) | 0.81% | 0.98% |
Similar Demographics by Vision Disability
Demographics Similar to Sudanese by Vision Disability
In terms of vision disability, the demographic groups most similar to Sudanese are Immigrants from Chile (2.1%, a difference of 0.030%), Immigrants from Peru (2.1%, a difference of 0.060%), Immigrants from Cameroon (2.1%, a difference of 0.070%), Immigrants from Kenya (2.1%, a difference of 0.070%), and Immigrants from Hungary (2.1%, a difference of 0.090%).
| Demographics | Rating | Rank | Vision Disability |
| Immigrants | Zimbabwe | 91.0 /100 | #120 | Exceptional 2.1% |
| Immigrants | Scotland | 90.4 /100 | #121 | Exceptional 2.1% |
| Immigrants | Ukraine | 90.4 /100 | #122 | Exceptional 2.1% |
| Immigrants | Albania | 90.4 /100 | #123 | Exceptional 2.1% |
| Immigrants | Spain | 89.8 /100 | #124 | Excellent 2.1% |
| Immigrants | Venezuela | 89.8 /100 | #125 | Excellent 2.1% |
| Immigrants | Peru | 89.5 /100 | #126 | Excellent 2.1% |
| Sudanese | 89.2 /100 | #127 | Excellent 2.1% |
| Immigrants | Chile | 89.0 /100 | #128 | Excellent 2.1% |
| Immigrants | Cameroon | 88.8 /100 | #129 | Excellent 2.1% |
| Immigrants | Kenya | 88.7 /100 | #130 | Excellent 2.1% |
| Immigrants | Hungary | 88.7 /100 | #131 | Excellent 2.1% |
| New Zealanders | 88.2 /100 | #132 | Excellent 2.1% |
| Syrians | 87.5 /100 | #133 | Excellent 2.1% |
| Venezuelans | 87.2 /100 | #134 | Excellent 2.1% |
Demographics Similar to Immigrants from Ireland by Vision Disability
In terms of vision disability, the demographic groups most similar to Immigrants from Ireland are Cypriot (2.0%, a difference of 0.030%), Immigrants from Ethiopia (2.0%, a difference of 0.18%), Zimbabwean (2.0%, a difference of 0.20%), Eastern European (2.0%, a difference of 0.24%), and Immigrants from Kuwait (2.0%, a difference of 0.26%).
| Demographics | Rating | Rank | Vision Disability |
| Immigrants | Egypt | 99.9 /100 | #33 | Exceptional 1.9% |
| Immigrants | Turkey | 99.8 /100 | #34 | Exceptional 1.9% |
| Immigrants | Australia | 99.8 /100 | #35 | Exceptional 1.9% |
| Cambodians | 99.8 /100 | #36 | Exceptional 2.0% |
| Bhutanese | 99.8 /100 | #37 | Exceptional 2.0% |
| Immigrants | Kuwait | 99.8 /100 | #38 | Exceptional 2.0% |
| Zimbabweans | 99.7 /100 | #39 | Exceptional 2.0% |
| Immigrants | Ireland | 99.7 /100 | #40 | Exceptional 2.0% |
| Cypriots | 99.7 /100 | #41 | Exceptional 2.0% |
| Immigrants | Ethiopia | 99.7 /100 | #42 | Exceptional 2.0% |
| Eastern Europeans | 99.7 /100 | #43 | Exceptional 2.0% |
| Immigrants | Indonesia | 99.7 /100 | #44 | Exceptional 2.0% |
| Ethiopians | 99.7 /100 | #45 | Exceptional 2.0% |
| Immigrants | Sweden | 99.7 /100 | #46 | Exceptional 2.0% |
| Immigrants | Bulgaria | 99.7 /100 | #47 | Exceptional 2.0% |