Sudanese vs Immigrants from Romania Vision Disability
COMPARE
Sudanese
Immigrants from Romania
Vision Disability
Vision Disability Comparison
Sudanese
Immigrants from Romania
2.1%
VISION DISABILITY
89.2/ 100
METRIC RATING
127th/ 347
METRIC RANK
2.0%
VISION DISABILITY
99.1/ 100
METRIC RATING
60th/ 347
METRIC RANK
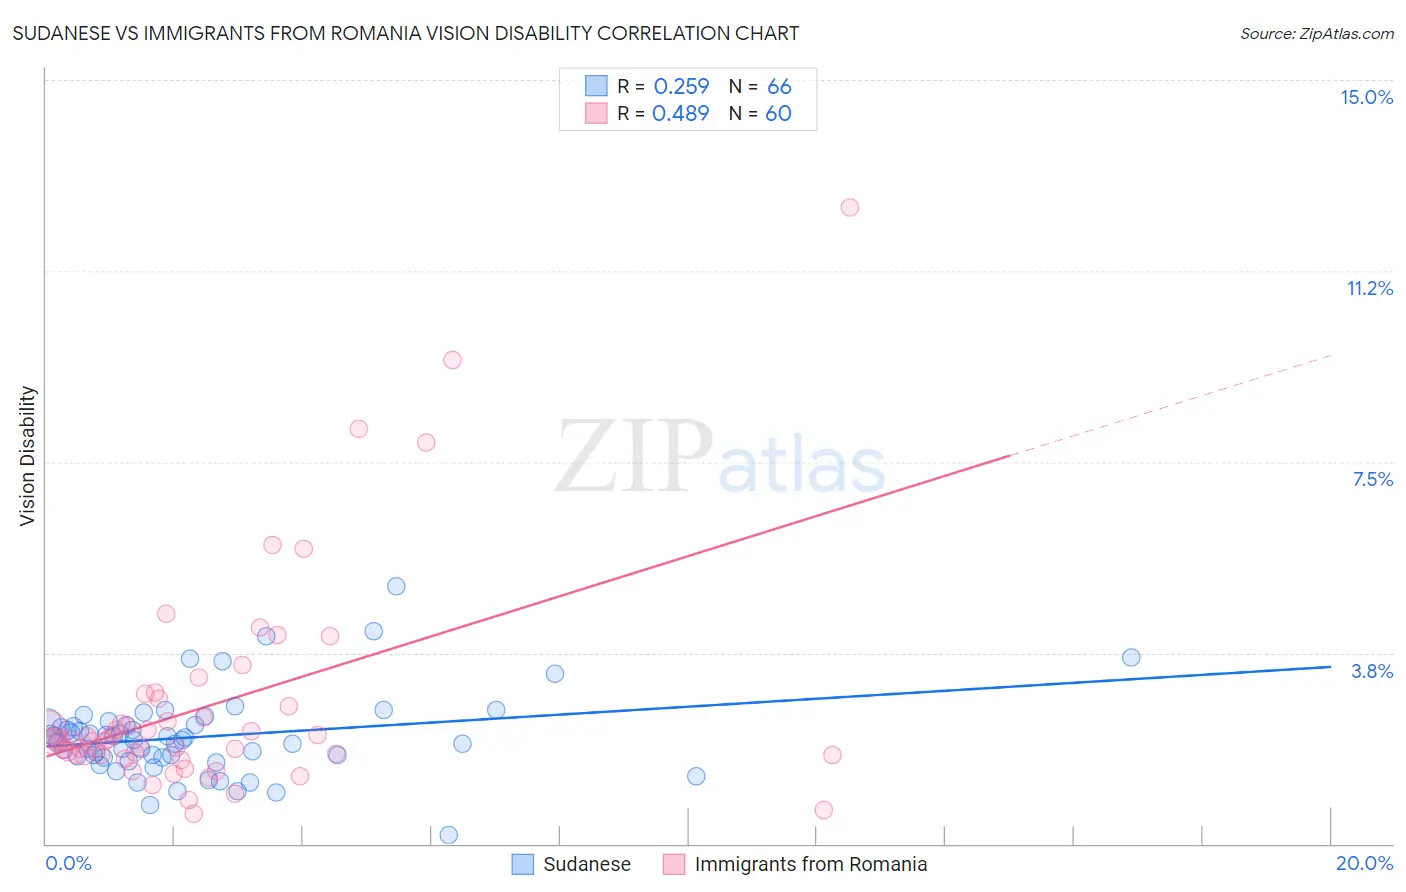
Sudanese vs Immigrants from Romania Vision Disability Correlation Chart
The statistical analysis conducted on geographies consisting of 110,115,679 people shows a weak positive correlation between the proportion of Sudanese and percentage of population with vision disability in the United States with a correlation coefficient (R) of 0.259 and weighted average of 2.1%. Similarly, the statistical analysis conducted on geographies consisting of 256,950,873 people shows a moderate positive correlation between the proportion of Immigrants from Romania and percentage of population with vision disability in the United States with a correlation coefficient (R) of 0.489 and weighted average of 2.0%, a difference of 4.4%.
Vision Disability Correlation Summary
| Measurement | Sudanese | Immigrants from Romania |
| Minimum | 0.17% | 0.58% |
| Maximum | 5.1% | 12.5% |
| Range | 4.9% | 11.9% |
| Mean | 2.1% | 2.7% |
| Median | 2.0% | 2.0% |
| Interquartile 25% (IQ1) | 1.7% | 1.7% |
| Interquartile 75% (IQ3) | 2.3% | 2.8% |
| Interquartile Range (IQR) | 0.64% | 1.0% |
| Standard Deviation (Sample) | 0.82% | 2.2% |
| Standard Deviation (Population) | 0.81% | 2.1% |
Similar Demographics by Vision Disability
Demographics Similar to Sudanese by Vision Disability
In terms of vision disability, the demographic groups most similar to Sudanese are Immigrants from Chile (2.1%, a difference of 0.030%), Immigrants from Peru (2.1%, a difference of 0.060%), Immigrants from Cameroon (2.1%, a difference of 0.070%), Immigrants from Kenya (2.1%, a difference of 0.070%), and Immigrants from Hungary (2.1%, a difference of 0.090%).
| Demographics | Rating | Rank | Vision Disability |
| Immigrants | Zimbabwe | 91.0 /100 | #120 | Exceptional 2.1% |
| Immigrants | Scotland | 90.4 /100 | #121 | Exceptional 2.1% |
| Immigrants | Ukraine | 90.4 /100 | #122 | Exceptional 2.1% |
| Immigrants | Albania | 90.4 /100 | #123 | Exceptional 2.1% |
| Immigrants | Spain | 89.8 /100 | #124 | Excellent 2.1% |
| Immigrants | Venezuela | 89.8 /100 | #125 | Excellent 2.1% |
| Immigrants | Peru | 89.5 /100 | #126 | Excellent 2.1% |
| Sudanese | 89.2 /100 | #127 | Excellent 2.1% |
| Immigrants | Chile | 89.0 /100 | #128 | Excellent 2.1% |
| Immigrants | Cameroon | 88.8 /100 | #129 | Excellent 2.1% |
| Immigrants | Kenya | 88.7 /100 | #130 | Excellent 2.1% |
| Immigrants | Hungary | 88.7 /100 | #131 | Excellent 2.1% |
| New Zealanders | 88.2 /100 | #132 | Excellent 2.1% |
| Syrians | 87.5 /100 | #133 | Excellent 2.1% |
| Venezuelans | 87.2 /100 | #134 | Excellent 2.1% |
Demographics Similar to Immigrants from Romania by Vision Disability
In terms of vision disability, the demographic groups most similar to Immigrants from Romania are Immigrants from Belgium (2.0%, a difference of 0.010%), Argentinean (2.0%, a difference of 0.030%), Immigrants from Russia (2.0%, a difference of 0.030%), Armenian (2.0%, a difference of 0.15%), and Immigrants from Saudi Arabia (2.0%, a difference of 0.17%).
| Demographics | Rating | Rank | Vision Disability |
| Immigrants | Belarus | 99.3 /100 | #53 | Exceptional 2.0% |
| Macedonians | 99.3 /100 | #54 | Exceptional 2.0% |
| Laotians | 99.3 /100 | #55 | Exceptional 2.0% |
| Jordanians | 99.2 /100 | #56 | Exceptional 2.0% |
| Somalis | 99.2 /100 | #57 | Exceptional 2.0% |
| Immigrants | Saudi Arabia | 99.2 /100 | #58 | Exceptional 2.0% |
| Argentineans | 99.1 /100 | #59 | Exceptional 2.0% |
| Immigrants | Romania | 99.1 /100 | #60 | Exceptional 2.0% |
| Immigrants | Belgium | 99.1 /100 | #61 | Exceptional 2.0% |
| Immigrants | Russia | 99.1 /100 | #62 | Exceptional 2.0% |
| Armenians | 99.0 /100 | #63 | Exceptional 2.0% |
| Immigrants | Greece | 99.0 /100 | #64 | Exceptional 2.0% |
| Maltese | 98.9 /100 | #65 | Exceptional 2.0% |
| Immigrants | Argentina | 98.9 /100 | #66 | Exceptional 2.0% |
| Immigrants | Northern Africa | 98.8 /100 | #67 | Exceptional 2.0% |