Samoan vs Immigrants from Italy Disability
COMPARE
Samoan
Immigrants from Italy
Disability
Disability Comparison
Samoans
Immigrants from Italy
12.2%
DISABILITY
2.6/ 100
METRIC RATING
230th/ 347
METRIC RANK
11.4%
DISABILITY
90.4/ 100
METRIC RATING
127th/ 347
METRIC RANK
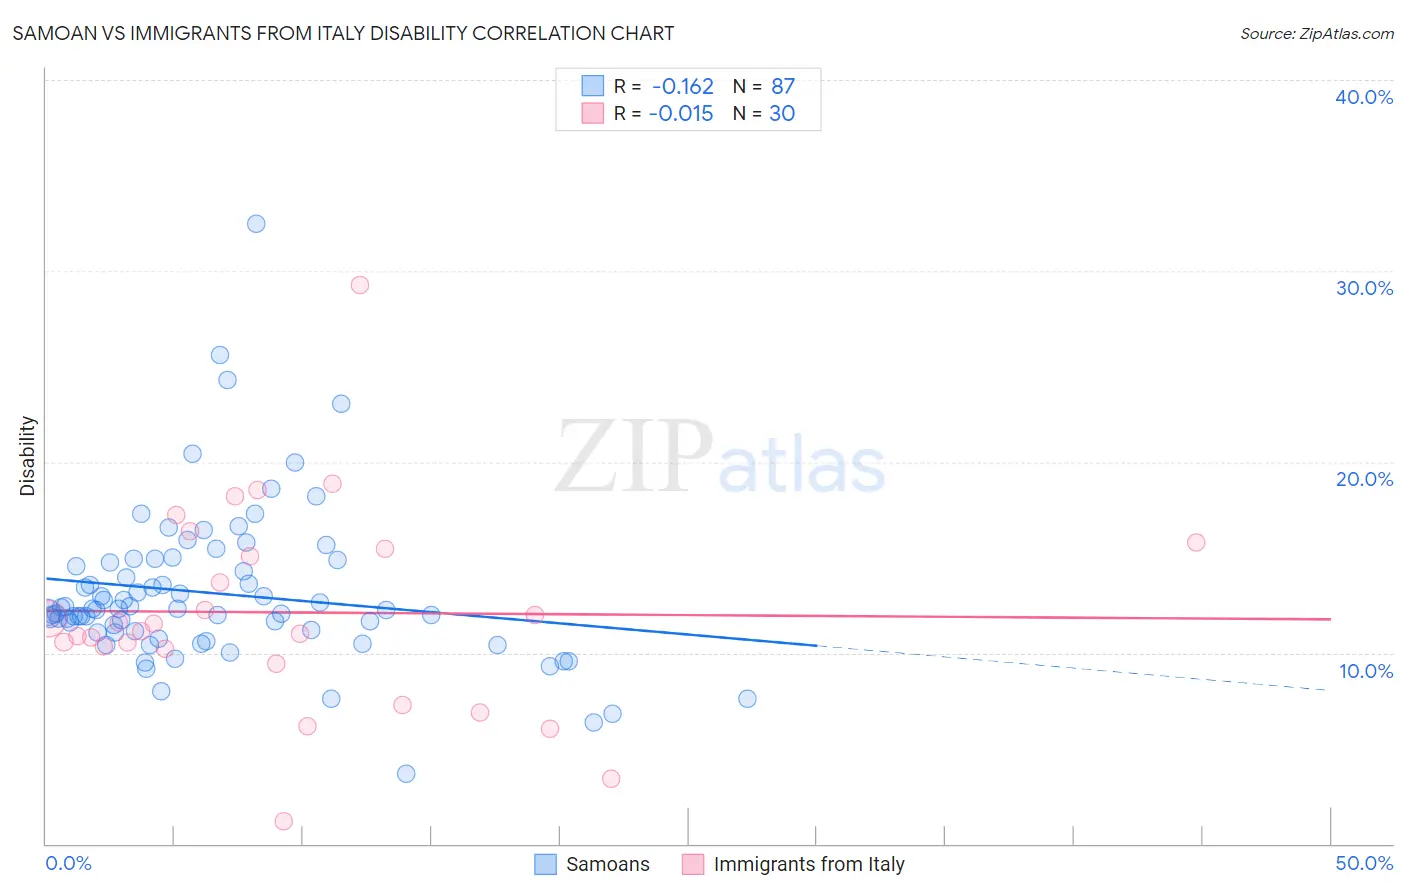
Samoan vs Immigrants from Italy Disability Correlation Chart
The statistical analysis conducted on geographies consisting of 225,125,318 people shows a poor negative correlation between the proportion of Samoans and percentage of population with a disability in the United States with a correlation coefficient (R) of -0.162 and weighted average of 12.2%. Similarly, the statistical analysis conducted on geographies consisting of 324,217,000 people shows no correlation between the proportion of Immigrants from Italy and percentage of population with a disability in the United States with a correlation coefficient (R) of -0.015 and weighted average of 11.4%, a difference of 6.7%.
Disability Correlation Summary
| Measurement | Samoan | Immigrants from Italy |
| Minimum | 3.6% | 1.2% |
| Maximum | 32.5% | 29.3% |
| Range | 28.8% | 28.1% |
| Mean | 13.1% | 12.1% |
| Median | 12.3% | 11.3% |
| Interquartile 25% (IQ1) | 11.1% | 10.2% |
| Interquartile 75% (IQ3) | 14.7% | 15.4% |
| Interquartile Range (IQR) | 3.6% | 5.2% |
| Standard Deviation (Sample) | 4.1% | 5.4% |
| Standard Deviation (Population) | 4.1% | 5.3% |
Similar Demographics by Disability
Demographics Similar to Samoans by Disability
In terms of disability, the demographic groups most similar to Samoans are Malaysian (12.2%, a difference of 0.030%), Italian (12.2%, a difference of 0.040%), Inupiat (12.2%, a difference of 0.080%), West Indian (12.2%, a difference of 0.10%), and Bahamian (12.2%, a difference of 0.13%).
| Demographics | Rating | Rank | Disability |
| Hispanics or Latinos | 3.9 /100 | #223 | Tragic 12.1% |
| Mexicans | 3.7 /100 | #224 | Tragic 12.1% |
| Senegalese | 3.5 /100 | #225 | Tragic 12.1% |
| Jamaicans | 3.3 /100 | #226 | Tragic 12.1% |
| Alsatians | 3.3 /100 | #227 | Tragic 12.1% |
| West Indians | 2.9 /100 | #228 | Tragic 12.2% |
| Inupiat | 2.8 /100 | #229 | Tragic 12.2% |
| Samoans | 2.6 /100 | #230 | Tragic 12.2% |
| Malaysians | 2.5 /100 | #231 | Tragic 12.2% |
| Italians | 2.5 /100 | #232 | Tragic 12.2% |
| Bahamians | 2.3 /100 | #233 | Tragic 12.2% |
| Japanese | 2.3 /100 | #234 | Tragic 12.2% |
| Yup'ik | 2.2 /100 | #235 | Tragic 12.2% |
| Chinese | 2.0 /100 | #236 | Tragic 12.2% |
| Immigrants | Congo | 1.9 /100 | #237 | Tragic 12.2% |
Demographics Similar to Immigrants from Italy by Disability
In terms of disability, the demographic groups most similar to Immigrants from Italy are Immigrants from Europe (11.4%, a difference of 0.0%), Macedonian (11.4%, a difference of 0.020%), Immigrants from Latvia (11.4%, a difference of 0.070%), Latvian (11.4%, a difference of 0.070%), and Immigrants from Croatia (11.4%, a difference of 0.080%).
| Demographics | Rating | Rank | Disability |
| Immigrants | North Macedonia | 93.5 /100 | #120 | Exceptional 11.4% |
| Immigrants | Costa Rica | 93.4 /100 | #121 | Exceptional 11.4% |
| Brazilians | 93.3 /100 | #122 | Exceptional 11.4% |
| South Africans | 92.3 /100 | #123 | Exceptional 11.4% |
| South American Indians | 92.2 /100 | #124 | Exceptional 11.4% |
| Costa Ricans | 91.9 /100 | #125 | Exceptional 11.4% |
| Immigrants | Latvia | 90.9 /100 | #126 | Exceptional 11.4% |
| Immigrants | Italy | 90.4 /100 | #127 | Exceptional 11.4% |
| Immigrants | Europe | 90.4 /100 | #128 | Exceptional 11.4% |
| Macedonians | 90.3 /100 | #129 | Exceptional 11.4% |
| Latvians | 89.8 /100 | #130 | Excellent 11.4% |
| Immigrants | Croatia | 89.8 /100 | #131 | Excellent 11.4% |
| Immigrants | Africa | 89.3 /100 | #132 | Excellent 11.4% |
| Arabs | 89.1 /100 | #133 | Excellent 11.4% |
| Immigrants | Guyana | 88.3 /100 | #134 | Excellent 11.4% |