Sudanese vs Mongolian Disability
COMPARE
Sudanese
Mongolian
Disability
Disability Comparison
Sudanese
Mongolians
11.5%
DISABILITY
77.1/ 100
METRIC RATING
148th/ 347
METRIC RANK
10.8%
DISABILITY
99.9/ 100
METRIC RATING
40th/ 347
METRIC RANK
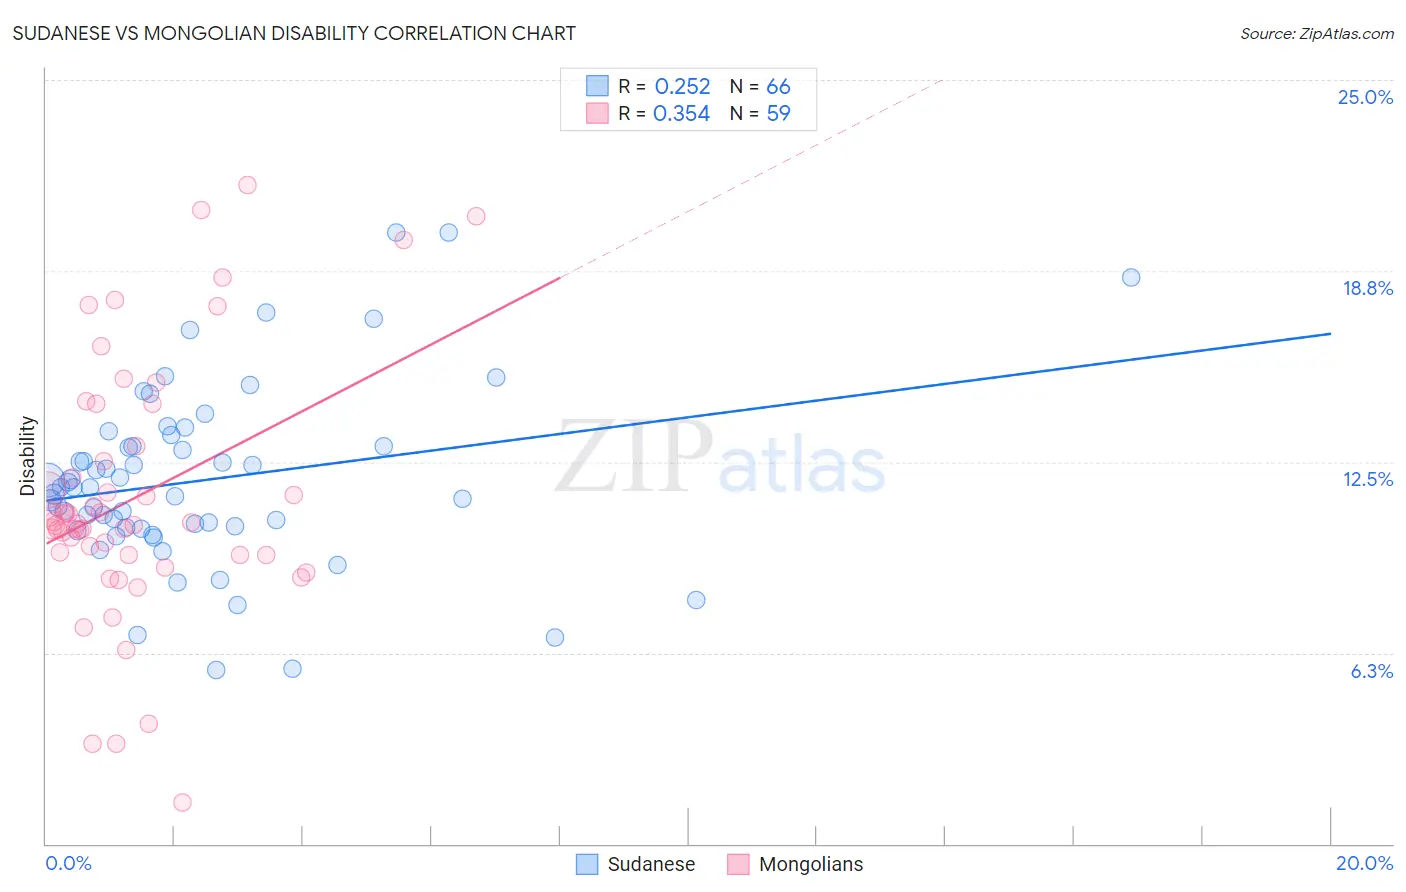
Sudanese vs Mongolian Disability Correlation Chart
The statistical analysis conducted on geographies consisting of 110,141,954 people shows a weak positive correlation between the proportion of Sudanese and percentage of population with a disability in the United States with a correlation coefficient (R) of 0.252 and weighted average of 11.5%. Similarly, the statistical analysis conducted on geographies consisting of 140,360,971 people shows a mild positive correlation between the proportion of Mongolians and percentage of population with a disability in the United States with a correlation coefficient (R) of 0.354 and weighted average of 10.8%, a difference of 7.2%.
Disability Correlation Summary
| Measurement | Sudanese | Mongolian |
| Minimum | 5.7% | 1.4% |
| Maximum | 20.0% | 21.6% |
| Range | 14.3% | 20.2% |
| Mean | 11.9% | 11.3% |
| Median | 11.7% | 10.5% |
| Interquartile 25% (IQ1) | 10.3% | 9.5% |
| Interquartile 75% (IQ3) | 13.0% | 13.0% |
| Interquartile Range (IQR) | 2.7% | 3.5% |
| Standard Deviation (Sample) | 2.9% | 4.2% |
| Standard Deviation (Population) | 2.9% | 4.2% |
Similar Demographics by Disability
Demographics Similar to Sudanese by Disability
In terms of disability, the demographic groups most similar to Sudanese are Immigrants from Ukraine (11.5%, a difference of 0.030%), Immigrants from Hungary (11.5%, a difference of 0.12%), Immigrants from Norway (11.6%, a difference of 0.24%), Romanian (11.6%, a difference of 0.27%), and Nigerian (11.5%, a difference of 0.29%).
| Demographics | Rating | Rank | Disability |
| Immigrants | Grenada | 86.1 /100 | #141 | Excellent 11.5% |
| Immigrants | Sudan | 85.3 /100 | #142 | Excellent 11.5% |
| Moroccans | 83.3 /100 | #143 | Excellent 11.5% |
| Australians | 82.5 /100 | #144 | Excellent 11.5% |
| Nigerians | 81.3 /100 | #145 | Excellent 11.5% |
| Immigrants | Hungary | 79.0 /100 | #146 | Good 11.5% |
| Immigrants | Ukraine | 77.6 /100 | #147 | Good 11.5% |
| Sudanese | 77.1 /100 | #148 | Good 11.5% |
| Immigrants | Norway | 73.2 /100 | #149 | Good 11.6% |
| Romanians | 72.7 /100 | #150 | Good 11.6% |
| Immigrants | Kenya | 72.1 /100 | #151 | Good 11.6% |
| Immigrants | Moldova | 72.0 /100 | #152 | Good 11.6% |
| Immigrants | Ghana | 71.2 /100 | #153 | Good 11.6% |
| Immigrants | Guatemala | 71.1 /100 | #154 | Good 11.6% |
| Immigrants | Netherlands | 69.8 /100 | #155 | Good 11.6% |
Demographics Similar to Mongolians by Disability
In terms of disability, the demographic groups most similar to Mongolians are Cambodian (10.8%, a difference of 0.0%), Immigrants from Australia (10.8%, a difference of 0.040%), Afghan (10.8%, a difference of 0.10%), Immigrants from Nepal (10.8%, a difference of 0.14%), and Israeli (10.8%, a difference of 0.19%).
| Demographics | Rating | Rank | Disability |
| Immigrants | Kuwait | 100.0 /100 | #33 | Exceptional 10.7% |
| Immigrants | Ethiopia | 100.0 /100 | #34 | Exceptional 10.7% |
| Immigrants | Indonesia | 100.0 /100 | #35 | Exceptional 10.7% |
| Ethiopians | 100.0 /100 | #36 | Exceptional 10.7% |
| Turks | 100.0 /100 | #37 | Exceptional 10.7% |
| Afghans | 99.9 /100 | #38 | Exceptional 10.8% |
| Cambodians | 99.9 /100 | #39 | Exceptional 10.8% |
| Mongolians | 99.9 /100 | #40 | Exceptional 10.8% |
| Immigrants | Australia | 99.9 /100 | #41 | Exceptional 10.8% |
| Immigrants | Nepal | 99.9 /100 | #42 | Exceptional 10.8% |
| Israelis | 99.9 /100 | #43 | Exceptional 10.8% |
| Immigrants | Japan | 99.9 /100 | #44 | Exceptional 10.8% |
| Immigrants | Peru | 99.9 /100 | #45 | Exceptional 10.8% |
| Tongans | 99.9 /100 | #46 | Exceptional 10.8% |
| Taiwanese | 99.9 /100 | #47 | Exceptional 10.8% |