Subsaharan African vs Immigrants from Guyana Male Disability
COMPARE
Subsaharan African
Immigrants from Guyana
Male Disability
Male Disability Comparison
Sub-Saharan Africans
Immigrants from Guyana
11.8%
MALE DISABILITY
2.8/ 100
METRIC RATING
226th/ 347
METRIC RANK
10.6%
MALE DISABILITY
98.2/ 100
METRIC RATING
82nd/ 347
METRIC RANK
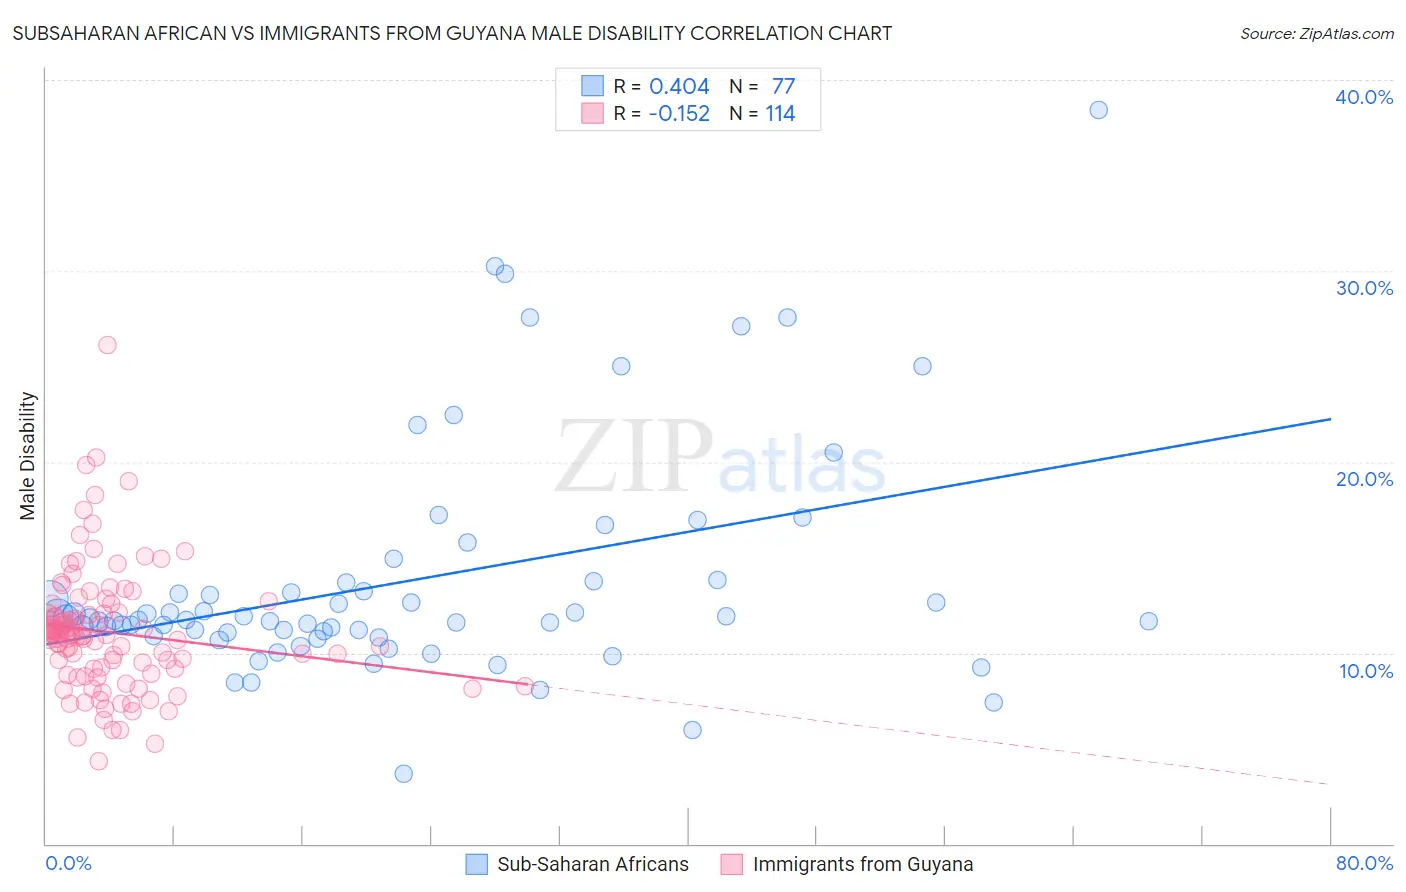
Subsaharan African vs Immigrants from Guyana Male Disability Correlation Chart
The statistical analysis conducted on geographies consisting of 508,010,863 people shows a moderate positive correlation between the proportion of Sub-Saharan Africans and percentage of males with a disability in the United States with a correlation coefficient (R) of 0.404 and weighted average of 11.8%. Similarly, the statistical analysis conducted on geographies consisting of 183,704,199 people shows a poor negative correlation between the proportion of Immigrants from Guyana and percentage of males with a disability in the United States with a correlation coefficient (R) of -0.152 and weighted average of 10.6%, a difference of 11.1%.
Male Disability Correlation Summary
| Measurement | Subsaharan African | Immigrants from Guyana |
| Minimum | 3.6% | 4.3% |
| Maximum | 38.5% | 26.1% |
| Range | 34.8% | 21.9% |
| Mean | 13.8% | 11.1% |
| Median | 11.7% | 10.9% |
| Interquartile 25% (IQ1) | 11.0% | 9.1% |
| Interquartile 75% (IQ3) | 13.7% | 12.1% |
| Interquartile Range (IQR) | 2.8% | 2.9% |
| Standard Deviation (Sample) | 6.1% | 3.3% |
| Standard Deviation (Population) | 6.0% | 3.3% |
Similar Demographics by Male Disability
Demographics Similar to Sub-Saharan Africans by Male Disability
In terms of male disability, the demographic groups most similar to Sub-Saharan Africans are Liberian (11.8%, a difference of 0.12%), Japanese (11.7%, a difference of 0.13%), Immigrants from Bahamas (11.7%, a difference of 0.15%), Austrian (11.8%, a difference of 0.18%), and Alsatian (11.7%, a difference of 0.24%).
| Demographics | Rating | Rank | Male Disability |
| Panamanians | 3.8 /100 | #219 | Tragic 11.7% |
| Immigrants | Western Europe | 3.8 /100 | #220 | Tragic 11.7% |
| Immigrants | Congo | 3.7 /100 | #221 | Tragic 11.7% |
| Alsatians | 3.3 /100 | #222 | Tragic 11.7% |
| Immigrants | Bahamas | 3.2 /100 | #223 | Tragic 11.7% |
| Japanese | 3.1 /100 | #224 | Tragic 11.7% |
| Liberians | 3.1 /100 | #225 | Tragic 11.8% |
| Sub-Saharan Africans | 2.8 /100 | #226 | Tragic 11.8% |
| Austrians | 2.5 /100 | #227 | Tragic 11.8% |
| Hispanics or Latinos | 2.3 /100 | #228 | Tragic 11.8% |
| Bermudans | 2.3 /100 | #229 | Tragic 11.8% |
| Croatians | 2.1 /100 | #230 | Tragic 11.8% |
| Dominicans | 1.8 /100 | #231 | Tragic 11.8% |
| Malaysians | 1.8 /100 | #232 | Tragic 11.8% |
| Mexicans | 1.7 /100 | #233 | Tragic 11.8% |
Demographics Similar to Immigrants from Guyana by Male Disability
In terms of male disability, the demographic groups most similar to Immigrants from Guyana are Immigrants from Poland (10.6%, a difference of 0.060%), Immigrants from Chile (10.6%, a difference of 0.070%), Bulgarian (10.6%, a difference of 0.080%), Immigrants from Jordan (10.6%, a difference of 0.13%), and Zimbabwean (10.6%, a difference of 0.15%).
| Demographics | Rating | Rank | Male Disability |
| Sierra Leoneans | 98.7 /100 | #75 | Exceptional 10.5% |
| Immigrants | Sierra Leone | 98.7 /100 | #76 | Exceptional 10.5% |
| Laotians | 98.6 /100 | #77 | Exceptional 10.6% |
| Immigrants | Russia | 98.6 /100 | #78 | Exceptional 10.6% |
| Zimbabweans | 98.4 /100 | #79 | Exceptional 10.6% |
| Immigrants | Jordan | 98.4 /100 | #80 | Exceptional 10.6% |
| Immigrants | Chile | 98.3 /100 | #81 | Exceptional 10.6% |
| Immigrants | Guyana | 98.2 /100 | #82 | Exceptional 10.6% |
| Immigrants | Poland | 98.1 /100 | #83 | Exceptional 10.6% |
| Bulgarians | 98.1 /100 | #84 | Exceptional 10.6% |
| Sri Lankans | 97.9 /100 | #85 | Exceptional 10.6% |
| Immigrants | Ireland | 97.9 /100 | #86 | Exceptional 10.6% |
| Immigrants | Vietnam | 97.9 /100 | #87 | Exceptional 10.6% |
| Immigrants | Western Asia | 97.8 /100 | #88 | Exceptional 10.6% |
| Immigrants | Nicaragua | 97.8 /100 | #89 | Exceptional 10.6% |