Subsaharan African vs Welsh 2 or more Vehicles in Household
COMPARE
Subsaharan African
Welsh
2 or more Vehicles in Household
2 or more Vehicles in Household Comparison
Sub-Saharan Africans
Welsh
51.9%
2 OR MORE VEHICLES IN HOUSEHOLD
0.2/ 100
METRIC RATING
272nd/ 347
METRIC RANK
60.8%
2 OR MORE VEHICLES IN HOUSEHOLD
100.0/ 100
METRIC RATING
26th/ 347
METRIC RANK
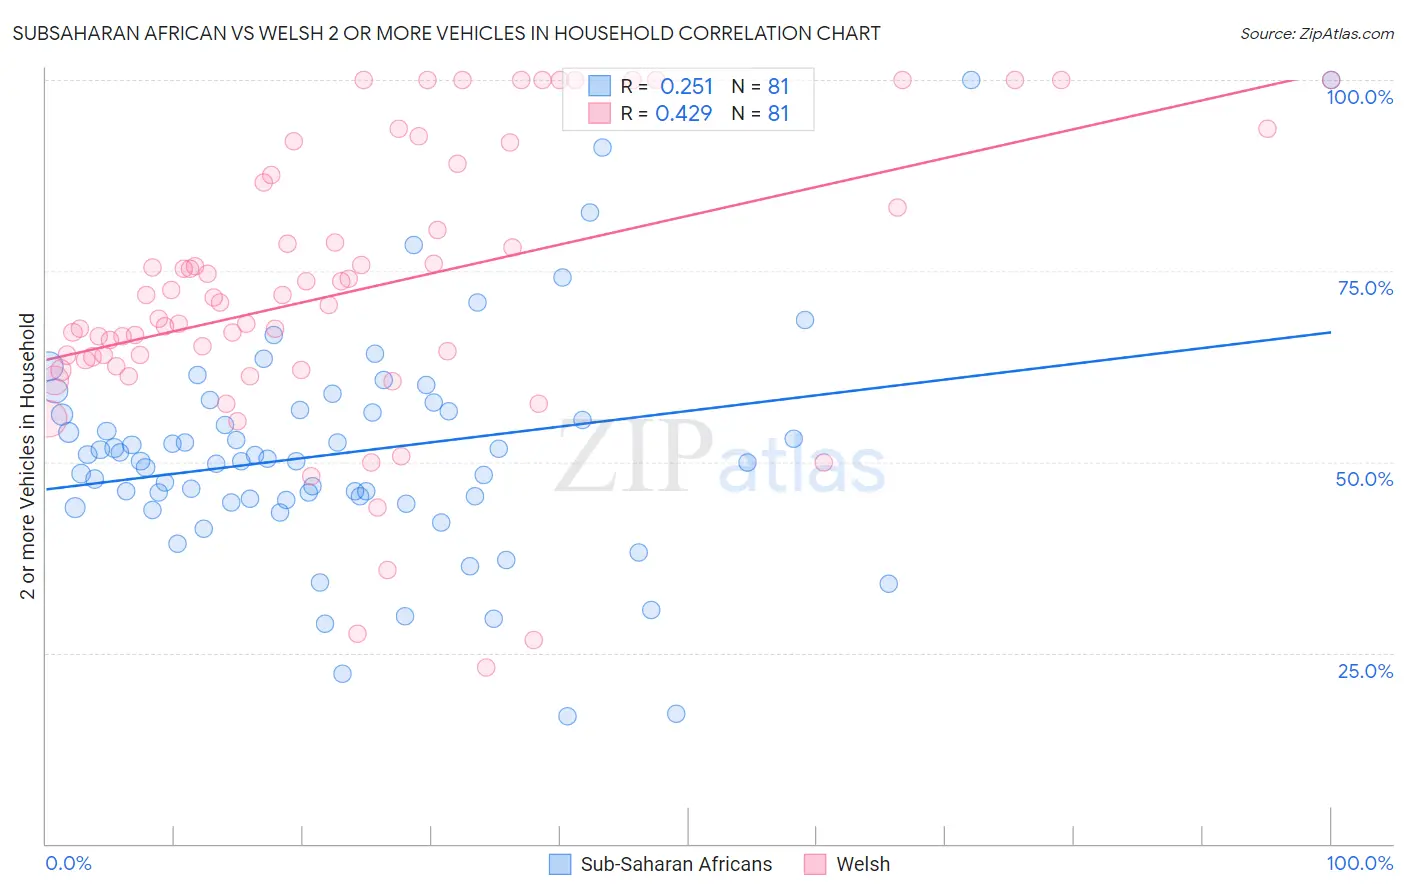
Subsaharan African vs Welsh 2 or more Vehicles in Household Correlation Chart
The statistical analysis conducted on geographies consisting of 507,665,982 people shows a weak positive correlation between the proportion of Sub-Saharan Africans and percentage of households with 2 or more vehicles available in the United States with a correlation coefficient (R) of 0.251 and weighted average of 51.9%. Similarly, the statistical analysis conducted on geographies consisting of 528,240,215 people shows a moderate positive correlation between the proportion of Welsh and percentage of households with 2 or more vehicles available in the United States with a correlation coefficient (R) of 0.429 and weighted average of 60.8%, a difference of 17.2%.
2 or more Vehicles in Household Correlation Summary
| Measurement | Subsaharan African | Welsh |
| Minimum | 16.7% | 23.1% |
| Maximum | 100.0% | 100.0% |
| Range | 83.3% | 76.9% |
| Mean | 51.2% | 72.5% |
| Median | 50.1% | 70.9% |
| Interquartile 25% (IQ1) | 44.8% | 62.9% |
| Interquartile 75% (IQ3) | 56.7% | 87.0% |
| Interquartile Range (IQR) | 11.9% | 24.1% |
| Standard Deviation (Sample) | 14.9% | 18.2% |
| Standard Deviation (Population) | 14.8% | 18.1% |
Similar Demographics by 2 or more Vehicles in Household
Demographics Similar to Sub-Saharan Africans by 2 or more Vehicles in Household
In terms of 2 or more vehicles in household, the demographic groups most similar to Sub-Saharan Africans are South American (51.9%, a difference of 0.020%), Israeli (51.9%, a difference of 0.090%), African (51.8%, a difference of 0.14%), Immigrants from Honduras (51.8%, a difference of 0.15%), and Immigrants from Croatia (51.8%, a difference of 0.18%).
| Demographics | Rating | Rank | 2 or more Vehicles in Household |
| Immigrants | Congo | 0.3 /100 | #265 | Tragic 52.1% |
| Immigrants | France | 0.2 /100 | #266 | Tragic 52.0% |
| Immigrants | Colombia | 0.2 /100 | #267 | Tragic 52.0% |
| Pima | 0.2 /100 | #268 | Tragic 52.0% |
| Hondurans | 0.2 /100 | #269 | Tragic 52.0% |
| Immigrants | Ireland | 0.2 /100 | #270 | Tragic 52.0% |
| South Americans | 0.2 /100 | #271 | Tragic 51.9% |
| Sub-Saharan Africans | 0.2 /100 | #272 | Tragic 51.9% |
| Israelis | 0.2 /100 | #273 | Tragic 51.9% |
| Africans | 0.2 /100 | #274 | Tragic 51.8% |
| Immigrants | Honduras | 0.2 /100 | #275 | Tragic 51.8% |
| Immigrants | Croatia | 0.2 /100 | #276 | Tragic 51.8% |
| Immigrants | Africa | 0.2 /100 | #277 | Tragic 51.8% |
| Yuman | 0.1 /100 | #278 | Tragic 51.7% |
| Liberians | 0.1 /100 | #279 | Tragic 51.7% |
Demographics Similar to Welsh by 2 or more Vehicles in Household
In terms of 2 or more vehicles in household, the demographic groups most similar to Welsh are White/Caucasian (60.8%, a difference of 0.050%), Immigrants from Vietnam (60.9%, a difference of 0.20%), Scotch-Irish (60.9%, a difference of 0.24%), Swiss (61.0%, a difference of 0.28%), and Korean (61.0%, a difference of 0.31%).
| Demographics | Rating | Rank | 2 or more Vehicles in Household |
| Scottish | 100.0 /100 | #19 | Exceptional 61.2% |
| Sri Lankans | 100.0 /100 | #20 | Exceptional 61.0% |
| Koreans | 100.0 /100 | #21 | Exceptional 61.0% |
| Swiss | 100.0 /100 | #22 | Exceptional 61.0% |
| Scotch-Irish | 100.0 /100 | #23 | Exceptional 60.9% |
| Immigrants | Vietnam | 100.0 /100 | #24 | Exceptional 60.9% |
| Whites/Caucasians | 100.0 /100 | #25 | Exceptional 60.8% |
| Welsh | 100.0 /100 | #26 | Exceptional 60.8% |
| Assyrians/Chaldeans/Syriacs | 100.0 /100 | #27 | Exceptional 60.5% |
| Guamanians/Chamorros | 100.0 /100 | #28 | Exceptional 60.5% |
| Hawaiians | 100.0 /100 | #29 | Exceptional 60.4% |
| Finns | 100.0 /100 | #30 | Exceptional 60.3% |
| Spanish American Indians | 100.0 /100 | #31 | Exceptional 60.3% |
| Arapaho | 100.0 /100 | #32 | Exceptional 60.2% |
| Immigrants | Mexico | 100.0 /100 | #33 | Exceptional 60.2% |