Sioux vs Scottish Disability Age 18 to 34
COMPARE
Sioux
Scottish
Disability Age 18 to 34
Disability Age 18 to 34 Comparison
Sioux
Scottish
8.2%
DISABILITY AGE 18 TO 34
0.0/ 100
METRIC RATING
327th/ 347
METRIC RANK
7.7%
DISABILITY AGE 18 TO 34
0.0/ 100
METRIC RATING
300th/ 347
METRIC RANK
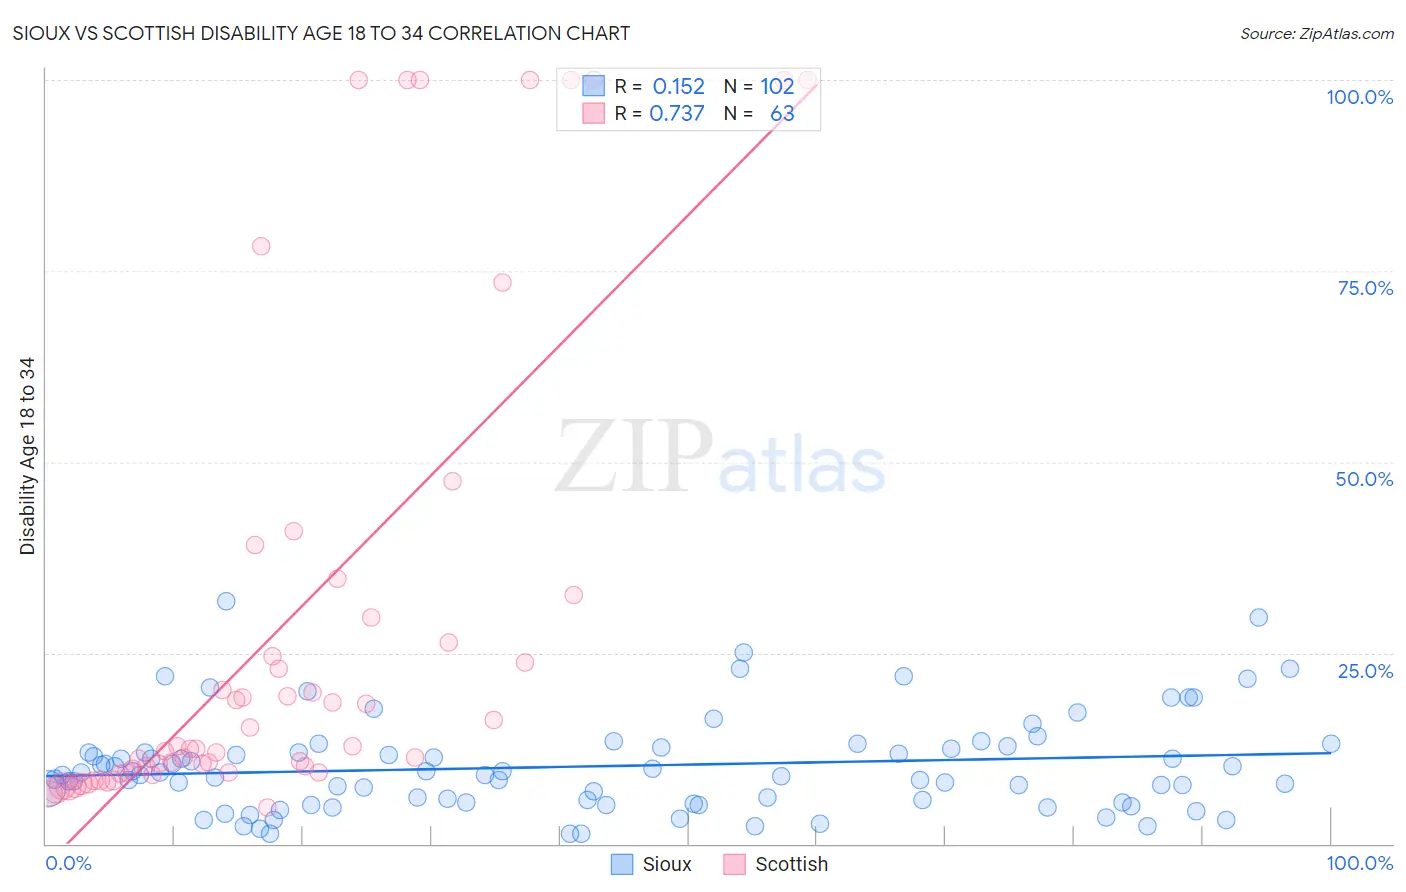
Sioux vs Scottish Disability Age 18 to 34 Correlation Chart
The statistical analysis conducted on geographies consisting of 233,703,351 people shows a poor positive correlation between the proportion of Sioux and percentage of population with a disability between the ages 18 and 35 in the United States with a correlation coefficient (R) of 0.152 and weighted average of 8.2%. Similarly, the statistical analysis conducted on geographies consisting of 561,209,610 people shows a strong positive correlation between the proportion of Scottish and percentage of population with a disability between the ages 18 and 35 in the United States with a correlation coefficient (R) of 0.737 and weighted average of 7.7%, a difference of 6.4%.
Disability Age 18 to 34 Correlation Summary
| Measurement | Sioux | Scottish |
| Minimum | 1.3% | 4.8% |
| Maximum | 31.8% | 100.0% |
| Range | 30.5% | 95.2% |
| Mean | 10.1% | 28.0% |
| Median | 9.0% | 12.5% |
| Interquartile 25% (IQ1) | 5.4% | 9.3% |
| Interquartile 75% (IQ3) | 12.5% | 29.6% |
| Interquartile Range (IQR) | 7.1% | 20.3% |
| Standard Deviation (Sample) | 6.2% | 30.9% |
| Standard Deviation (Population) | 6.2% | 30.7% |
Similar Demographics by Disability Age 18 to 34
Demographics Similar to Sioux by Disability Age 18 to 34
In terms of disability age 18 to 34, the demographic groups most similar to Sioux are Delaware (8.2%, a difference of 0.050%), Potawatomi (8.2%, a difference of 0.13%), Native/Alaskan (8.2%, a difference of 0.14%), Crow (8.3%, a difference of 0.57%), and Cajun (8.2%, a difference of 0.67%).
| Demographics | Rating | Rank | Disability Age 18 to 34 |
| Navajo | 0.0 /100 | #320 | Tragic 8.1% |
| Blackfeet | 0.0 /100 | #321 | Tragic 8.1% |
| Cree | 0.0 /100 | #322 | Tragic 8.1% |
| French American Indians | 0.0 /100 | #323 | Tragic 8.2% |
| Cajuns | 0.0 /100 | #324 | Tragic 8.2% |
| Natives/Alaskans | 0.0 /100 | #325 | Tragic 8.2% |
| Potawatomi | 0.0 /100 | #326 | Tragic 8.2% |
| Sioux | 0.0 /100 | #327 | Tragic 8.2% |
| Delaware | 0.0 /100 | #328 | Tragic 8.2% |
| Crow | 0.0 /100 | #329 | Tragic 8.3% |
| Osage | 0.0 /100 | #330 | Tragic 8.3% |
| Comanche | 0.0 /100 | #331 | Tragic 8.3% |
| Puget Sound Salish | 0.0 /100 | #332 | Tragic 8.3% |
| Apache | 0.0 /100 | #333 | Tragic 8.4% |
| Dutch West Indians | 0.0 /100 | #334 | Tragic 8.4% |
Demographics Similar to Scottish by Disability Age 18 to 34
In terms of disability age 18 to 34, the demographic groups most similar to Scottish are German (7.7%, a difference of 0.010%), Pima (7.7%, a difference of 0.060%), Welsh (7.7%, a difference of 0.14%), Cheyenne (7.7%, a difference of 0.20%), and Dutch (7.7%, a difference of 0.25%).
| Demographics | Rating | Rank | Disability Age 18 to 34 |
| Scandinavians | 0.0 /100 | #293 | Tragic 7.7% |
| Immigrants | Cabo Verde | 0.0 /100 | #294 | Tragic 7.7% |
| Tlingit-Haida | 0.0 /100 | #295 | Tragic 7.7% |
| Cape Verdeans | 0.0 /100 | #296 | Tragic 7.7% |
| Pueblo | 0.0 /100 | #297 | Tragic 7.7% |
| Dutch | 0.0 /100 | #298 | Tragic 7.7% |
| Germans | 0.0 /100 | #299 | Tragic 7.7% |
| Scottish | 0.0 /100 | #300 | Tragic 7.7% |
| Pima | 0.0 /100 | #301 | Tragic 7.7% |
| Welsh | 0.0 /100 | #302 | Tragic 7.7% |
| Cheyenne | 0.0 /100 | #303 | Tragic 7.7% |
| Shoshone | 0.0 /100 | #304 | Tragic 7.8% |
| Menominee | 0.0 /100 | #305 | Tragic 7.8% |
| English | 0.0 /100 | #306 | Tragic 7.8% |
| Scotch-Irish | 0.0 /100 | #307 | Tragic 7.8% |