Subsaharan African vs Japanese Hearing Disability
COMPARE
Subsaharan African
Japanese
Hearing Disability
Hearing Disability Comparison
Sub-Saharan Africans
Japanese
2.9%
HEARING DISABILITY
83.3/ 100
METRIC RATING
141st/ 347
METRIC RANK
3.0%
HEARING DISABILITY
46.0/ 100
METRIC RATING
178th/ 347
METRIC RANK
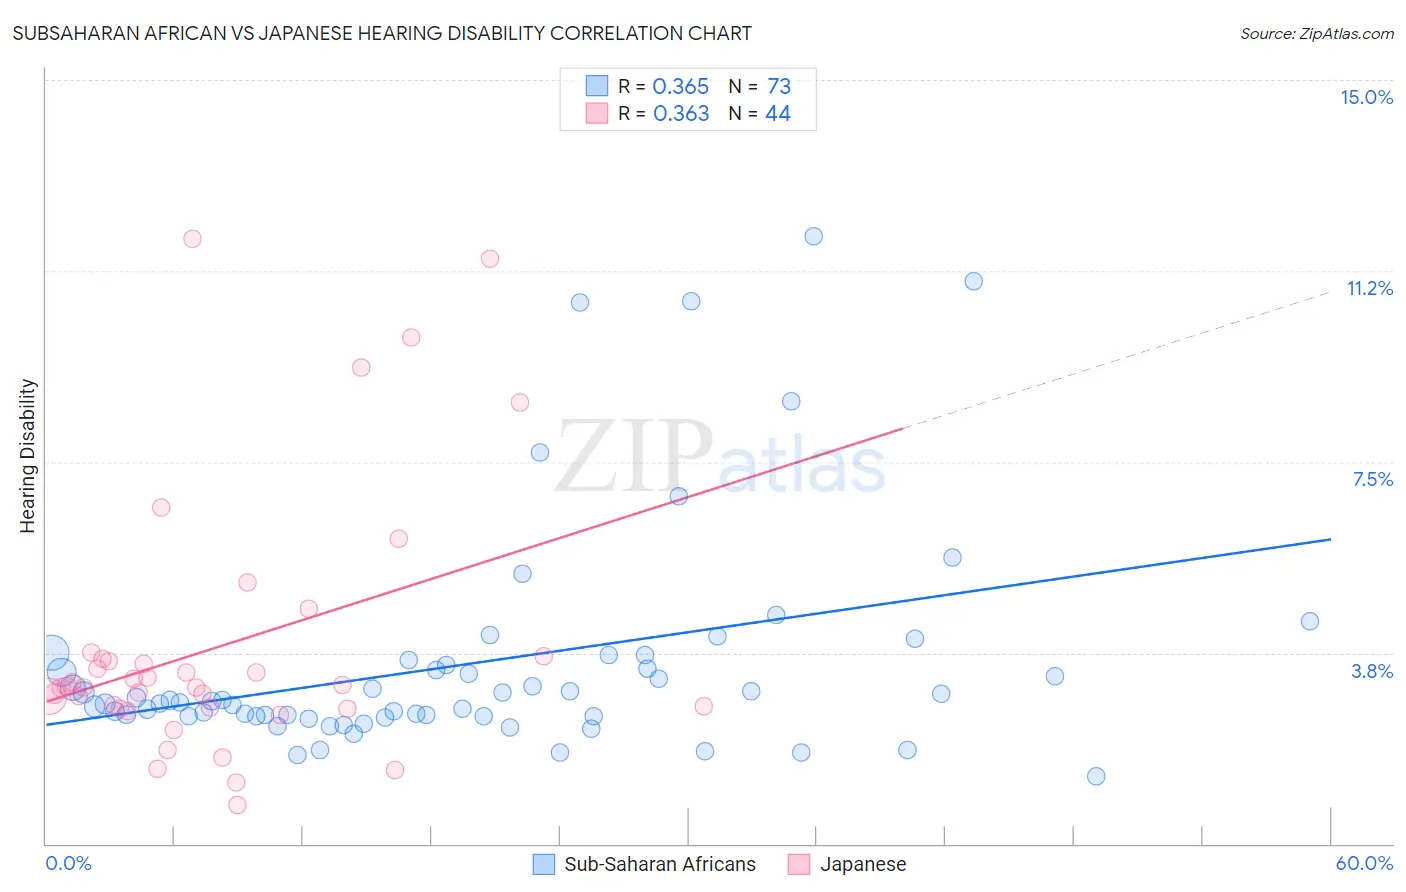
Subsaharan African vs Japanese Hearing Disability Correlation Chart
The statistical analysis conducted on geographies consisting of 507,755,219 people shows a mild positive correlation between the proportion of Sub-Saharan Africans and percentage of population with hearing disability in the United States with a correlation coefficient (R) of 0.365 and weighted average of 2.9%. Similarly, the statistical analysis conducted on geographies consisting of 249,105,269 people shows a mild positive correlation between the proportion of Japanese and percentage of population with hearing disability in the United States with a correlation coefficient (R) of 0.363 and weighted average of 3.0%, a difference of 4.3%.
Hearing Disability Correlation Summary
| Measurement | Subsaharan African | Japanese |
| Minimum | 1.3% | 0.75% |
| Maximum | 11.9% | 11.9% |
| Range | 10.6% | 11.1% |
| Mean | 3.5% | 3.9% |
| Median | 2.8% | 3.1% |
| Interquartile 25% (IQ1) | 2.5% | 2.7% |
| Interquartile 75% (IQ3) | 3.6% | 3.7% |
| Interquartile Range (IQR) | 1.0% | 1.0% |
| Standard Deviation (Sample) | 2.2% | 2.6% |
| Standard Deviation (Population) | 2.2% | 2.6% |
Similar Demographics by Hearing Disability
Demographics Similar to Sub-Saharan Africans by Hearing Disability
In terms of hearing disability, the demographic groups most similar to Sub-Saharan Africans are Immigrants from Jordan (2.9%, a difference of 0.070%), Bermudan (2.9%, a difference of 0.090%), Immigrants from Costa Rica (2.9%, a difference of 0.13%), Sri Lankan (2.9%, a difference of 0.14%), and Immigrants from Brazil (2.9%, a difference of 0.24%).
| Demographics | Rating | Rank | Hearing Disability |
| Ugandans | 85.5 /100 | #134 | Excellent 2.9% |
| Soviet Union | 84.8 /100 | #135 | Excellent 2.9% |
| Immigrants | Brazil | 84.6 /100 | #136 | Excellent 2.9% |
| Sri Lankans | 84.1 /100 | #137 | Excellent 2.9% |
| Immigrants | Costa Rica | 84.0 /100 | #138 | Excellent 2.9% |
| Bermudans | 83.8 /100 | #139 | Excellent 2.9% |
| Immigrants | Jordan | 83.7 /100 | #140 | Excellent 2.9% |
| Sub-Saharan Africans | 83.3 /100 | #141 | Excellent 2.9% |
| Laotians | 81.1 /100 | #142 | Excellent 2.9% |
| Immigrants | Bahamas | 80.9 /100 | #143 | Excellent 2.9% |
| Immigrants | Bulgaria | 79.2 /100 | #144 | Good 2.9% |
| Immigrants | Congo | 78.9 /100 | #145 | Good 2.9% |
| Brazilians | 78.7 /100 | #146 | Good 2.9% |
| Tongans | 78.6 /100 | #147 | Good 2.9% |
| Immigrants | Russia | 77.7 /100 | #148 | Good 2.9% |
Demographics Similar to Japanese by Hearing Disability
In terms of hearing disability, the demographic groups most similar to Japanese are Immigrants from Philippines (3.0%, a difference of 0.040%), Panamanian (3.0%, a difference of 0.10%), Immigrants from Romania (3.0%, a difference of 0.23%), Immigrants from Moldova (3.0%, a difference of 0.28%), and Immigrants from Sweden (3.0%, a difference of 0.34%).
| Demographics | Rating | Rank | Hearing Disability |
| Immigrants | Ukraine | 56.6 /100 | #171 | Average 3.0% |
| Armenians | 56.0 /100 | #172 | Average 3.0% |
| Immigrants | Serbia | 51.1 /100 | #173 | Average 3.0% |
| Indonesians | 50.0 /100 | #174 | Average 3.0% |
| Immigrants | Romania | 48.4 /100 | #175 | Average 3.0% |
| Panamanians | 47.0 /100 | #176 | Average 3.0% |
| Immigrants | Philippines | 46.4 /100 | #177 | Average 3.0% |
| Japanese | 46.0 /100 | #178 | Average 3.0% |
| Immigrants | Moldova | 43.1 /100 | #179 | Average 3.0% |
| Immigrants | Sweden | 42.4 /100 | #180 | Average 3.0% |
| Immigrants | Belgium | 41.5 /100 | #181 | Average 3.0% |
| Immigrants | Italy | 41.1 /100 | #182 | Average 3.0% |
| Bulgarians | 39.7 /100 | #183 | Fair 3.0% |
| Immigrants | Ireland | 37.4 /100 | #184 | Fair 3.0% |
| Immigrants | Southern Europe | 35.3 /100 | #185 | Fair 3.0% |