Immigrants from Serbia vs Japanese Hearing Disability
COMPARE
Immigrants from Serbia
Japanese
Hearing Disability
Hearing Disability Comparison
Immigrants from Serbia
Japanese
3.0%
HEARING DISABILITY
51.1/ 100
METRIC RATING
173rd/ 347
METRIC RANK
3.0%
HEARING DISABILITY
46.0/ 100
METRIC RATING
178th/ 347
METRIC RANK
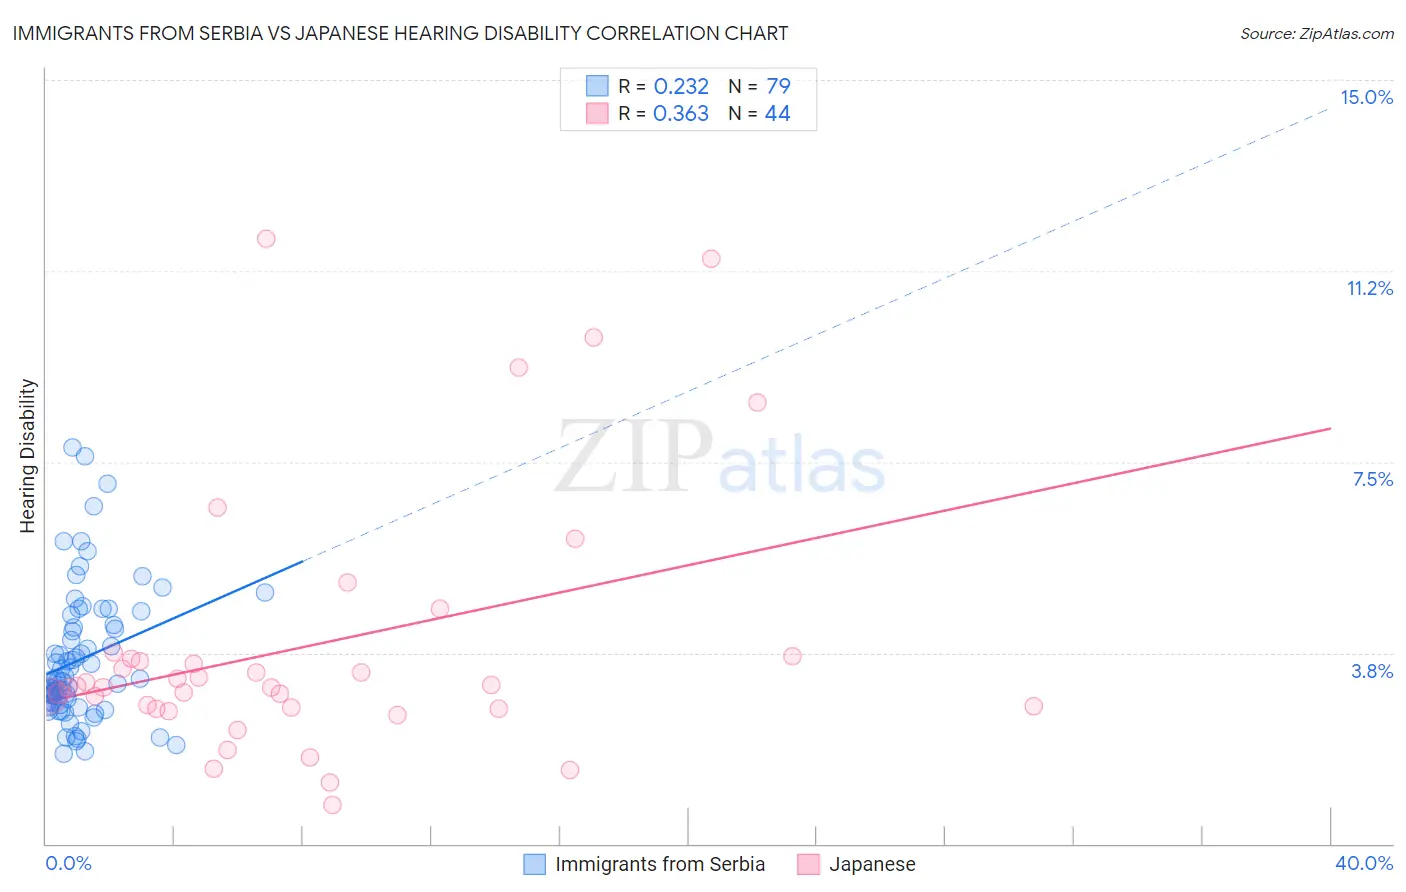
Immigrants from Serbia vs Japanese Hearing Disability Correlation Chart
The statistical analysis conducted on geographies consisting of 131,744,668 people shows a weak positive correlation between the proportion of Immigrants from Serbia and percentage of population with hearing disability in the United States with a correlation coefficient (R) of 0.232 and weighted average of 3.0%. Similarly, the statistical analysis conducted on geographies consisting of 249,105,269 people shows a mild positive correlation between the proportion of Japanese and percentage of population with hearing disability in the United States with a correlation coefficient (R) of 0.363 and weighted average of 3.0%, a difference of 0.48%.
Hearing Disability Correlation Summary
| Measurement | Immigrants from Serbia | Japanese |
| Minimum | 1.8% | 0.75% |
| Maximum | 7.8% | 11.9% |
| Range | 6.0% | 11.1% |
| Mean | 3.6% | 3.9% |
| Median | 3.2% | 3.1% |
| Interquartile 25% (IQ1) | 2.7% | 2.7% |
| Interquartile 75% (IQ3) | 4.3% | 3.7% |
| Interquartile Range (IQR) | 1.6% | 1.0% |
| Standard Deviation (Sample) | 1.3% | 2.6% |
| Standard Deviation (Population) | 1.3% | 2.6% |
Demographics Similar to Immigrants from Serbia and Japanese by Hearing Disability
In terms of hearing disability, the demographic groups most similar to Immigrants from Serbia are Indonesian (3.0%, a difference of 0.10%), Immigrants from Romania (3.0%, a difference of 0.25%), Panamanian (3.0%, a difference of 0.38%), Immigrants from Philippines (3.0%, a difference of 0.44%), and Armenian (3.0%, a difference of 0.47%). Similarly, the demographic groups most similar to Japanese are Immigrants from Philippines (3.0%, a difference of 0.040%), Panamanian (3.0%, a difference of 0.10%), Immigrants from Romania (3.0%, a difference of 0.23%), Immigrants from Moldova (3.0%, a difference of 0.28%), and Immigrants from Sweden (3.0%, a difference of 0.34%).
| Demographics | Rating | Rank | Hearing Disability |
| Immigrants | Zimbabwe | 64.2 /100 | #165 | Good 3.0% |
| Immigrants | South Eastern Asia | 62.9 /100 | #166 | Good 3.0% |
| Immigrants | Eastern Europe | 58.1 /100 | #167 | Average 3.0% |
| Immigrants | Greece | 57.9 /100 | #168 | Average 3.0% |
| Arabs | 57.6 /100 | #169 | Average 3.0% |
| Immigrants | Cabo Verde | 56.9 /100 | #170 | Average 3.0% |
| Immigrants | Ukraine | 56.6 /100 | #171 | Average 3.0% |
| Armenians | 56.0 /100 | #172 | Average 3.0% |
| Immigrants | Serbia | 51.1 /100 | #173 | Average 3.0% |
| Indonesians | 50.0 /100 | #174 | Average 3.0% |
| Immigrants | Romania | 48.4 /100 | #175 | Average 3.0% |
| Panamanians | 47.0 /100 | #176 | Average 3.0% |
| Immigrants | Philippines | 46.4 /100 | #177 | Average 3.0% |
| Japanese | 46.0 /100 | #178 | Average 3.0% |
| Immigrants | Moldova | 43.1 /100 | #179 | Average 3.0% |
| Immigrants | Sweden | 42.4 /100 | #180 | Average 3.0% |
| Immigrants | Belgium | 41.5 /100 | #181 | Average 3.0% |
| Immigrants | Italy | 41.1 /100 | #182 | Average 3.0% |
| Bulgarians | 39.7 /100 | #183 | Fair 3.0% |
| Immigrants | Ireland | 37.4 /100 | #184 | Fair 3.0% |
| Immigrants | Southern Europe | 35.3 /100 | #185 | Fair 3.0% |