Subsaharan African vs Armenian Hearing Disability

COMPARE

Subsaharan African
Race
Ancestry
AfghanAfricanAlaska NativeAlaskan AthabascanAlbanianAleutAlsatianAmericanApacheArabArapahoArgentineanAssyrian/Chaldean/SyriacAustralianAustrianBahamianBangladeshiBarbadianBasqueBelgianBelizeanBermudanBhutaneseBlackfeetBolivianBrazilianBritishBritish West IndianBulgarianBurmeseCajunCambodianCanadianCape VerdeanCarpatho RusynCelticCentral AmericanCentral American IndianCherokeeCheyenneChickasawChileanChineseChippewaChoctawColombianColvilleComancheCosta RicanCreeCreekCroatianCrowCubanCypriotCzechCzechoslovakianDanishDelawareDominicanDutchDutch West IndianEastern EuropeanEcuadorianEgyptianEnglishEstonianEthiopianEuropeanFijianFilipinoFinnishFrenchFrench American IndianFrench CanadianGermanGerman RussianGhanaianGreekGuamanian/ChamorroGuatemalanGuyaneseHaitianHmongHonduranHopiHoumaHungarianIcelanderIndian (Asian)IndonesianInupiatIranianIraqiIrishIroquoisIsraeliItalianJamaicanJapaneseJordanianKenyanKiowaKoreanLaotianLatvianLebaneseLiberianLithuanianLumbeeLuxembourgerMacedonianMalaysianMalteseMarshalleseMenomineeMexicanMexican American IndianMongolianMoroccanNative HawaiianNavajoNepaleseNew ZealanderNicaraguanNigerianNorthern EuropeanNorwegianOkinawanOsageOttawaPaiutePakistaniPalestinianPanamanianParaguayanPennsylvania GermanPeruvianPimaPolishPortuguesePotawatomiPuebloPuerto RicanPuget Sound SalishRomanianRussianSalvadoranSamoanScandinavianScotch-IrishScottishSeminoleSenegaleseSerbianShoshoneSierra LeoneanSiouxSlavicSlovakSloveneSomaliSouth AfricanSouth AmericanSouth American IndianSoviet UnionSpaniardSpanishSpanish AmericanSpanish American IndianSri LankanSubsaharan AfricanSudaneseSwedishSwissSyrianTaiwaneseThaiTlingit-HaidaTohono O'OdhamTonganTrinidadian and TobagonianTsimshianTurkishU.S. Virgin IslanderUgandanUkrainianUruguayanUteVenezuelanVietnameseWelshWest IndianYakamaYaquiYugoslavianYumanYup'ikZimbabwean
Immigration
NonimmigrantsImmigrantsAfghanistanAfricaAlbaniaArgentinaArmeniaAsiaAustraliaAustriaBahamasBangladeshBarbadosBelarusBelgiumBelizeBoliviaBosnia and HerzegovinaBrazilBulgariaBurma/MyanmarCabo VerdeCambodiaCameroonCanadaCaribbeanCentral AmericaChileChinaColombiaCongoCosta RicaCroatiaCubaCzechoslovakiaDenmarkDominicaDominican RepublicEastern AfricaEastern AsiaEastern EuropeEcuadorEgyptEl SalvadorEnglandEritreaEthiopiaEuropeFijiFranceGermanyGhanaGreeceGrenadaGuatemalaGuyanaHaitiHondurasHong KongHungaryIndiaIndonesiaIranIraqIrelandIsraelItalyJamaicaJapanJordanKazakhstanKenyaKoreaKuwaitLaosLatin AmericaLatviaLebanonLiberiaLithuaniaMalaysiaMexicoMicronesiaMiddle AfricaMoldovaMoroccoNepalNetherlandsNicaraguaNigeriaNorth AmericaNorth MacedoniaNorthern AfricaNorthern EuropeNorwayOceaniaPakistanPanamaPeruPhilippinesPolandPortugalRomaniaRussiaSaudi ArabiaScotlandSenegalSerbiaSierra LeoneSingaporeSomaliaSouth AfricaSouth AmericaSouth Central AsiaSouth Eastern AsiaSouthern EuropeSpainSri LankaSt. Vincent and the GrenadinesSudanSwedenSwitzerlandSyriaTaiwanThailandTrinidad and TobagoTurkeyUgandaUkraineUruguayUzbekistanVenezuelaVietnamWest IndiesWestern AfricaWestern AsiaWestern EuropeYemenZaireZimbabweAzores
Armenian
Race
Ancestry
AfghanAfricanAlaska NativeAlaskan AthabascanAlbanianAleutAlsatianAmericanApacheArabArapahoArgentineanArmenianAssyrian/Chaldean/SyriacAustralianAustrianBahamianBangladeshiBarbadianBasqueBelgianBelizeanBermudanBhutaneseBlackfeetBolivianBrazilianBritishBritish West IndianBulgarianBurmeseCajunCambodianCanadianCape VerdeanCarpatho RusynCelticCentral AmericanCentral American IndianCherokeeCheyenneChickasawChileanChineseChippewaChoctawColombianColvilleComancheCosta RicanCreeCreekCroatianCrowCubanCypriotCzechCzechoslovakianDanishDelawareDominicanDutchDutch West IndianEastern EuropeanEcuadorianEgyptianEnglishEstonianEthiopianEuropeanFijianFilipinoFinnishFrenchFrench American IndianFrench CanadianGermanGerman RussianGhanaianGreekGuamanian/ChamorroGuatemalanGuyaneseHaitianHmongHonduranHopiHoumaHungarianIcelanderIndian (Asian)IndonesianInupiatIranianIraqiIrishIroquoisIsraeliItalianJamaicanJapaneseJordanianKenyanKiowaKoreanLaotianLatvianLebaneseLiberianLithuanianLumbeeLuxembourgerMacedonianMalaysianMalteseMarshalleseMenomineeMexicanMexican American IndianMongolianMoroccanNative HawaiianNavajoNepaleseNew ZealanderNicaraguanNigerianNorthern EuropeanNorwegianOkinawanOsageOttawaPaiutePakistaniPalestinianPanamanianParaguayanPennsylvania GermanPeruvianPimaPolishPortuguesePotawatomiPuebloPuerto RicanPuget Sound SalishRomanianRussianSalvadoranSamoanScandinavianScotch-IrishScottishSeminoleSenegaleseSerbianShoshoneSierra LeoneanSiouxSlavicSlovakSloveneSomaliSouth AfricanSouth AmericanSouth American IndianSoviet UnionSpaniardSpanishSpanish AmericanSpanish American IndianSri LankanSudaneseSwedishSwissSyrianTaiwaneseThaiTlingit-HaidaTohono O'OdhamTonganTrinidadian and TobagonianTsimshianTurkishU.S. Virgin IslanderUgandanUkrainianUruguayanUteVenezuelanVietnameseWelshWest IndianYakamaYaquiYugoslavianYumanYup'ikZimbabwean
Immigration
NonimmigrantsImmigrantsAfghanistanAfricaAlbaniaArgentinaArmeniaAsiaAustraliaAustriaBahamasBangladeshBarbadosBelarusBelgiumBelizeBoliviaBosnia and HerzegovinaBrazilBulgariaBurma/MyanmarCabo VerdeCambodiaCameroonCanadaCaribbeanCentral AmericaChileChinaColombiaCongoCosta RicaCroatiaCubaCzechoslovakiaDenmarkDominicaDominican RepublicEastern AfricaEastern AsiaEastern EuropeEcuadorEgyptEl SalvadorEnglandEritreaEthiopiaEuropeFijiFranceGermanyGhanaGreeceGrenadaGuatemalaGuyanaHaitiHondurasHong KongHungaryIndiaIndonesiaIranIraqIrelandIsraelItalyJamaicaJapanJordanKazakhstanKenyaKoreaKuwaitLaosLatin AmericaLatviaLebanonLiberiaLithuaniaMalaysiaMexicoMicronesiaMiddle AfricaMoldovaMoroccoNepalNetherlandsNicaraguaNigeriaNorth AmericaNorth MacedoniaNorthern AfricaNorthern EuropeNorwayOceaniaPakistanPanamaPeruPhilippinesPolandPortugalRomaniaRussiaSaudi ArabiaScotlandSenegalSerbiaSierra LeoneSingaporeSomaliaSouth AfricaSouth AmericaSouth Central AsiaSouth Eastern AsiaSouthern EuropeSpainSri LankaSt. Vincent and the GrenadinesSudanSwedenSwitzerlandSyriaTaiwanThailandTrinidad and TobagoTurkeyUgandaUkraineUruguayUzbekistanVenezuelaVietnamWest IndiesWestern AfricaWestern AsiaWestern EuropeYemenZaireZimbabweAzores
Hearing Disability
Income
Poverty
Unemployment
Labor Participation
Family Structure
Vehicle Availability
Education Level
Disability

Hearing Disability Comparison

Sub-Saharan Africans

Armenians

Excellent
Average
2.9%
HEARING DISABILITY
83.3/ 100
METRIC RATING
141st/ 347
METRIC RANK
3.0%
HEARING DISABILITY
56.0/ 100
METRIC RATING
172nd/ 347
METRIC RANK

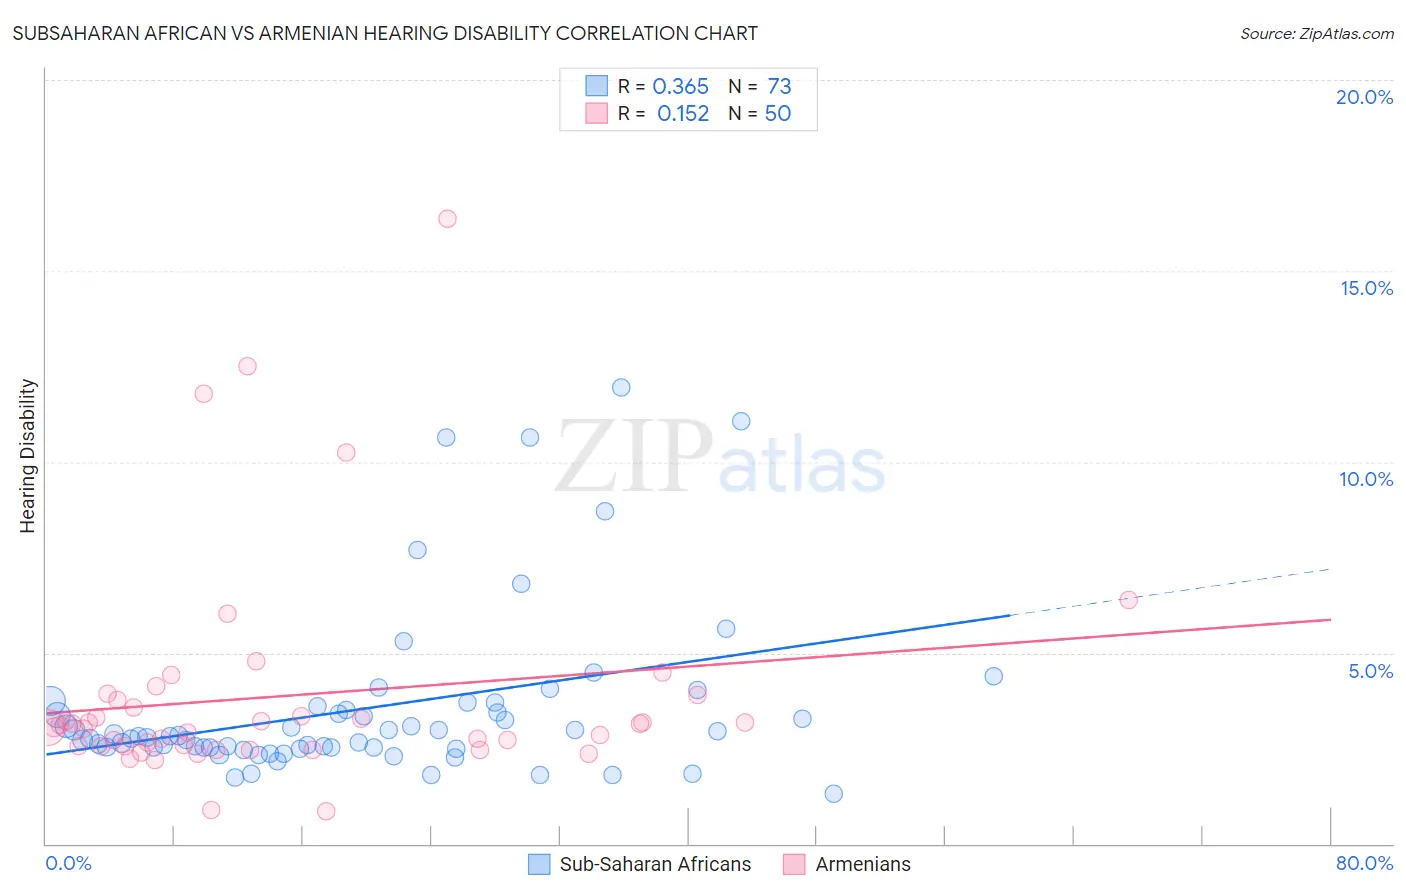
Subsaharan African vs Armenian Hearing Disability Correlation Chart

The statistical analysis conducted on geographies consisting of 507,755,219 people shows a mild positive correlation between the proportion of Sub-Saharan Africans and percentage of population with hearing disability in the United States with a correlation coefficient (R) of 0.365 and weighted average of 2.9%. Similarly, the statistical analysis conducted on geographies consisting of 310,889,694 people shows a poor positive correlation between the proportion of Armenians and percentage of population with hearing disability in the United States with a correlation coefficient (R) of 0.152 and weighted average of 3.0%, a difference of 3.3%.
Subsaharan African vs Armenian Hearing Disability

Hearing Disability Correlation Summary

MeasurementSubsaharan AfricanArmenian
Minimum1.3%0.86%
Maximum11.9%16.4%
Range10.6%15.5%
Mean3.5%3.9%
Median2.8%3.1%
Interquartile 25% (IQ1)2.5%2.6%
Interquartile 75% (IQ3)3.6%3.8%
Interquartile Range (IQR)1.0%1.2%
Standard Deviation (Sample)2.2%2.9%
Standard Deviation (Population)2.2%2.9%

Similar Demographics by Hearing Disability

Demographics Similar to Sub-Saharan Africans by Hearing Disability

In terms of hearing disability, the demographic groups most similar to Sub-Saharan Africans are Immigrants from Jordan (2.9%, a difference of 0.070%), Bermudan (2.9%, a difference of 0.090%), Immigrants from Costa Rica (2.9%, a difference of 0.13%), Sri Lankan (2.9%, a difference of 0.14%), and Immigrants from Brazil (2.9%, a difference of 0.24%).
DemographicsRating | RankHearing Disability
Ugandans
85.5
/100
|
#134
Excellent
2.9%
Soviet Union
84.8
/100
|
#135
Excellent
2.9%
Immigrants | Brazil
84.6
/100
|
#136
Excellent
2.9%
Sri Lankans
84.1
/100
|
#137
Excellent
2.9%
Immigrants | Costa Rica
84.0
/100
|
#138
Excellent
2.9%
Bermudans
83.8
/100
|
#139
Excellent
2.9%
Immigrants | Jordan
83.7
/100
|
#140
Excellent
2.9%
Sub-Saharan Africans
83.3
/100
|
#141
Excellent
2.9%
Laotians
81.1
/100
|
#142
Excellent
2.9%
Immigrants | Bahamas
80.9
/100
|
#143
Excellent
2.9%
Immigrants | Bulgaria
79.2
/100
|
#144
Good
2.9%
Immigrants | Congo
78.9
/100
|
#145
Good
2.9%
Brazilians
78.7
/100
|
#146
Good
2.9%
Tongans
78.6
/100
|
#147
Good
2.9%
Immigrants | Russia
77.7
/100
|
#148
Good
2.9%

Demographics Similar to Armenians by Hearing Disability

In terms of hearing disability, the demographic groups most similar to Armenians are Immigrants from Ukraine (3.0%, a difference of 0.060%), Immigrants from Cabo Verde (3.0%, a difference of 0.090%), Arab (3.0%, a difference of 0.15%), Immigrants from Greece (3.0%, a difference of 0.18%), and Immigrants from Eastern Europe (3.0%, a difference of 0.20%).
DemographicsRating | RankHearing Disability
Immigrants | Zimbabwe
64.2
/100
|
#165
Good
3.0%
Immigrants | South Eastern Asia
62.9
/100
|
#166
Good
3.0%
Immigrants | Eastern Europe
58.1
/100
|
#167
Average
3.0%
Immigrants | Greece
57.9
/100
|
#168
Average
3.0%
Arabs
57.6
/100
|
#169
Average
3.0%
Immigrants | Cabo Verde
56.9
/100
|
#170
Average
3.0%
Immigrants | Ukraine
56.6
/100
|
#171
Average
3.0%
Armenians
56.0
/100
|
#172
Average
3.0%
Immigrants | Serbia
51.1
/100
|
#173
Average
3.0%
Indonesians
50.0
/100
|
#174
Average
3.0%
Immigrants | Romania
48.4
/100
|
#175
Average
3.0%
Panamanians
47.0
/100
|
#176
Average
3.0%
Immigrants | Philippines
46.4
/100
|
#177
Average
3.0%
Japanese
46.0
/100
|
#178
Average
3.0%
Immigrants | Moldova
43.1
/100
|
#179
Average
3.0%