Subsaharan African vs Comanche Hearing Disability
COMPARE
Subsaharan African
Comanche
Hearing Disability
Hearing Disability Comparison
Sub-Saharan Africans
Comanche
2.9%
HEARING DISABILITY
83.3/ 100
METRIC RATING
141st/ 347
METRIC RANK
4.0%
HEARING DISABILITY
0.0/ 100
METRIC RATING
317th/ 347
METRIC RANK
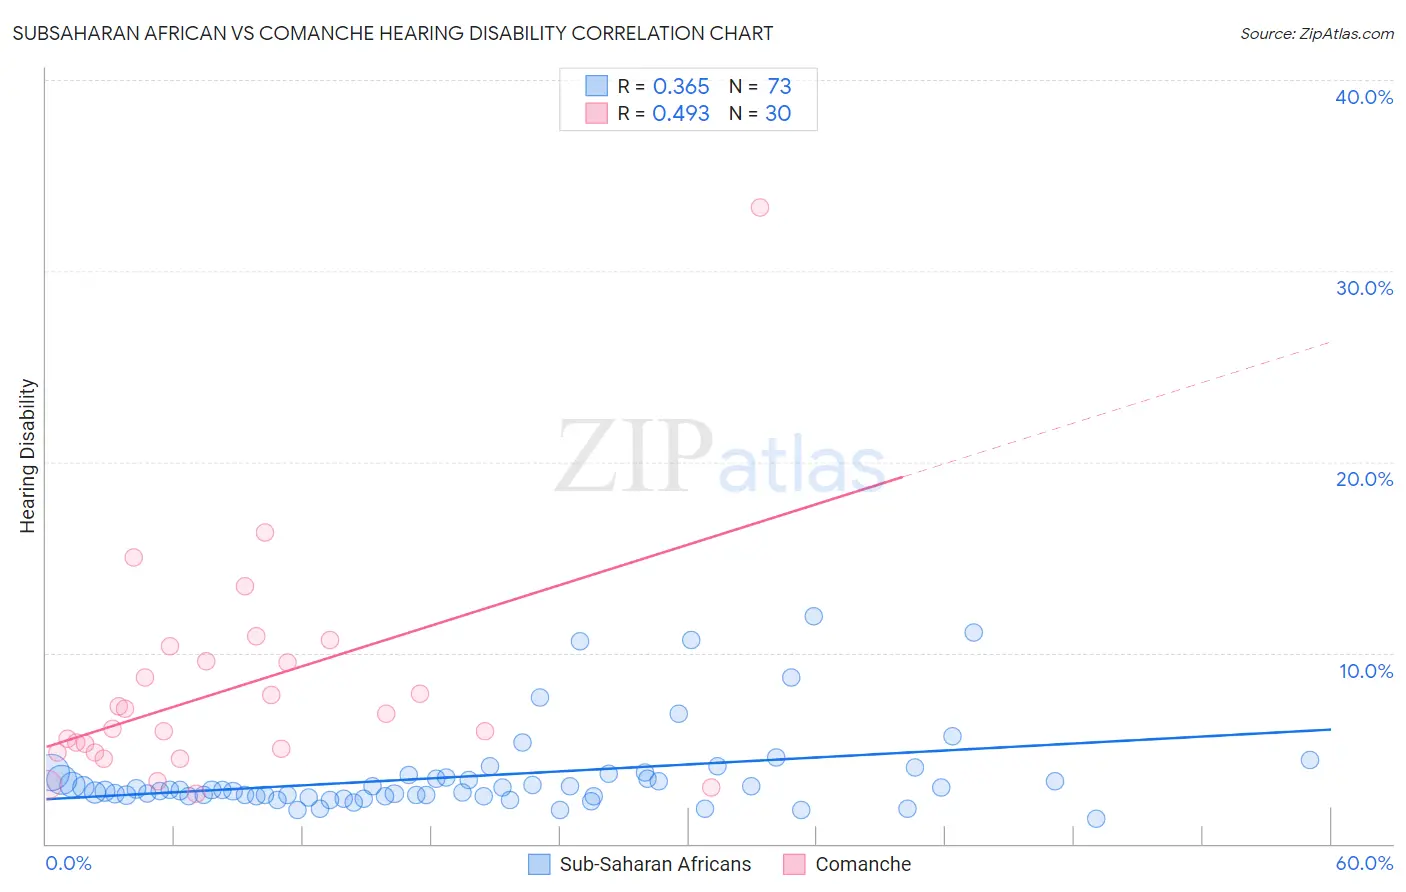
Subsaharan African vs Comanche Hearing Disability Correlation Chart
The statistical analysis conducted on geographies consisting of 507,755,219 people shows a mild positive correlation between the proportion of Sub-Saharan Africans and percentage of population with hearing disability in the United States with a correlation coefficient (R) of 0.365 and weighted average of 2.9%. Similarly, the statistical analysis conducted on geographies consisting of 109,751,188 people shows a moderate positive correlation between the proportion of Comanche and percentage of population with hearing disability in the United States with a correlation coefficient (R) of 0.493 and weighted average of 4.0%, a difference of 37.4%.
Hearing Disability Correlation Summary
| Measurement | Subsaharan African | Comanche |
| Minimum | 1.3% | 2.6% |
| Maximum | 11.9% | 33.3% |
| Range | 10.6% | 30.7% |
| Mean | 3.5% | 8.1% |
| Median | 2.8% | 6.4% |
| Interquartile 25% (IQ1) | 2.5% | 4.8% |
| Interquartile 75% (IQ3) | 3.6% | 9.6% |
| Interquartile Range (IQR) | 1.0% | 4.8% |
| Standard Deviation (Sample) | 2.2% | 5.9% |
| Standard Deviation (Population) | 2.2% | 5.8% |
Similar Demographics by Hearing Disability
Demographics Similar to Sub-Saharan Africans by Hearing Disability
In terms of hearing disability, the demographic groups most similar to Sub-Saharan Africans are Immigrants from Jordan (2.9%, a difference of 0.070%), Bermudan (2.9%, a difference of 0.090%), Immigrants from Costa Rica (2.9%, a difference of 0.13%), Sri Lankan (2.9%, a difference of 0.14%), and Immigrants from Brazil (2.9%, a difference of 0.24%).
| Demographics | Rating | Rank | Hearing Disability |
| Ugandans | 85.5 /100 | #134 | Excellent 2.9% |
| Soviet Union | 84.8 /100 | #135 | Excellent 2.9% |
| Immigrants | Brazil | 84.6 /100 | #136 | Excellent 2.9% |
| Sri Lankans | 84.1 /100 | #137 | Excellent 2.9% |
| Immigrants | Costa Rica | 84.0 /100 | #138 | Excellent 2.9% |
| Bermudans | 83.8 /100 | #139 | Excellent 2.9% |
| Immigrants | Jordan | 83.7 /100 | #140 | Excellent 2.9% |
| Sub-Saharan Africans | 83.3 /100 | #141 | Excellent 2.9% |
| Laotians | 81.1 /100 | #142 | Excellent 2.9% |
| Immigrants | Bahamas | 80.9 /100 | #143 | Excellent 2.9% |
| Immigrants | Bulgaria | 79.2 /100 | #144 | Good 2.9% |
| Immigrants | Congo | 78.9 /100 | #145 | Good 2.9% |
| Brazilians | 78.7 /100 | #146 | Good 2.9% |
| Tongans | 78.6 /100 | #147 | Good 2.9% |
| Immigrants | Russia | 77.7 /100 | #148 | Good 2.9% |
Demographics Similar to Comanche by Hearing Disability
In terms of hearing disability, the demographic groups most similar to Comanche are Spanish American (4.0%, a difference of 0.13%), Cheyenne (4.0%, a difference of 0.17%), Puget Sound Salish (3.9%, a difference of 0.33%), Yakama (3.9%, a difference of 0.34%), and Hopi (3.9%, a difference of 0.51%).
| Demographics | Rating | Rank | Hearing Disability |
| Cree | 0.0 /100 | #310 | Tragic 3.8% |
| Americans | 0.0 /100 | #311 | Tragic 3.9% |
| Cajuns | 0.0 /100 | #312 | Tragic 3.9% |
| Hopi | 0.0 /100 | #313 | Tragic 3.9% |
| Yakama | 0.0 /100 | #314 | Tragic 3.9% |
| Puget Sound Salish | 0.0 /100 | #315 | Tragic 3.9% |
| Spanish Americans | 0.0 /100 | #316 | Tragic 4.0% |
| Comanche | 0.0 /100 | #317 | Tragic 4.0% |
| Cheyenne | 0.0 /100 | #318 | Tragic 4.0% |
| Chippewa | 0.0 /100 | #319 | Tragic 4.0% |
| Shoshone | 0.0 /100 | #320 | Tragic 4.0% |
| Paiute | 0.0 /100 | #321 | Tragic 4.1% |
| Seminole | 0.0 /100 | #322 | Tragic 4.1% |
| Apache | 0.0 /100 | #323 | Tragic 4.1% |
| Osage | 0.0 /100 | #324 | Tragic 4.1% |