Subsaharan African vs Immigrants from South Central Asia Hearing Disability
COMPARE
Subsaharan African
Immigrants from South Central Asia
Hearing Disability
Hearing Disability Comparison
Sub-Saharan Africans
Immigrants from South Central Asia
2.9%
HEARING DISABILITY
83.3/ 100
METRIC RATING
141st/ 347
METRIC RANK
2.6%
HEARING DISABILITY
99.7/ 100
METRIC RATING
27th/ 347
METRIC RANK
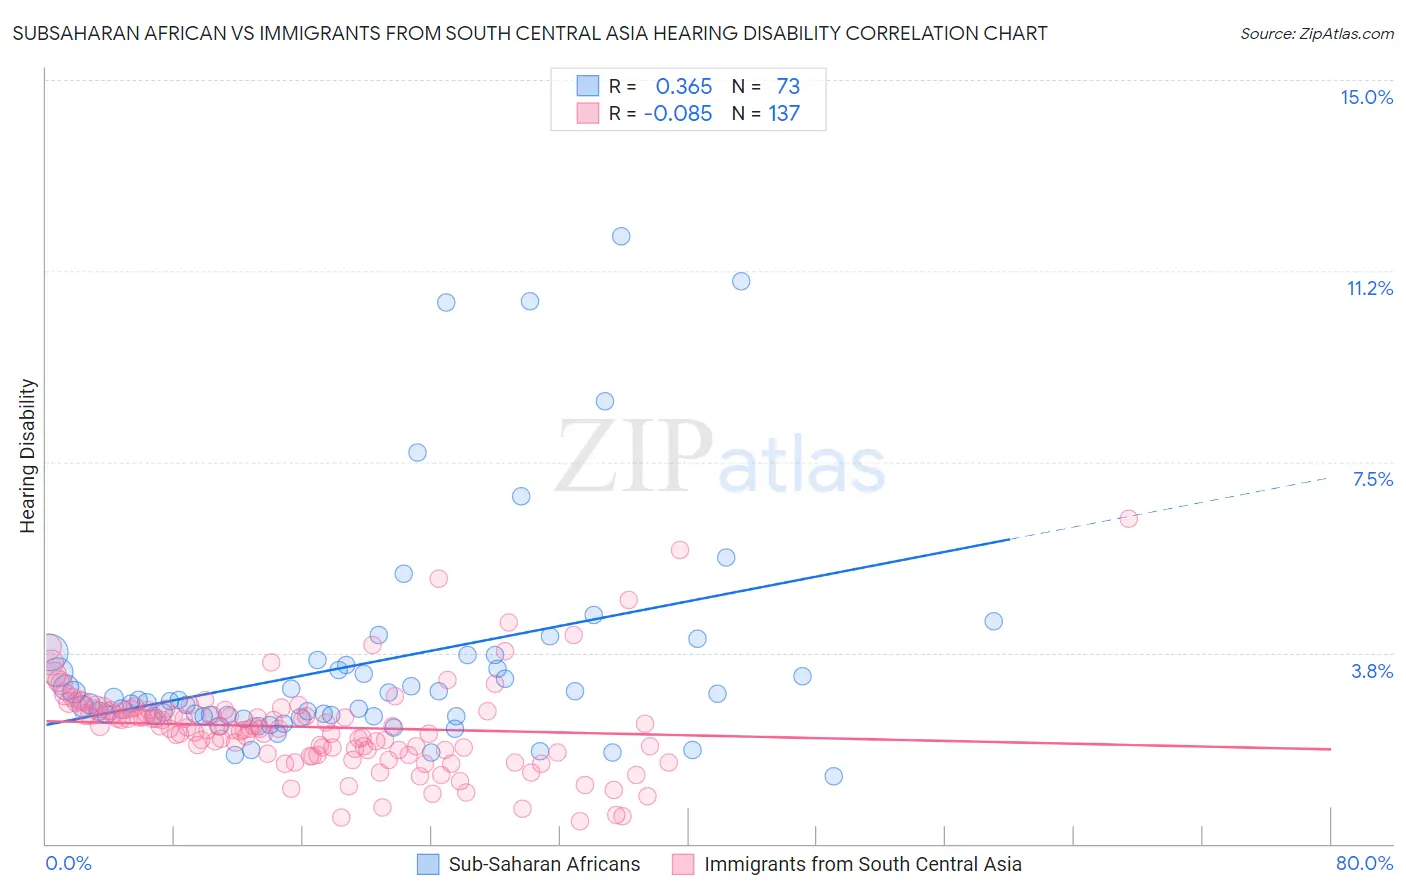
Subsaharan African vs Immigrants from South Central Asia Hearing Disability Correlation Chart
The statistical analysis conducted on geographies consisting of 507,755,219 people shows a mild positive correlation between the proportion of Sub-Saharan Africans and percentage of population with hearing disability in the United States with a correlation coefficient (R) of 0.365 and weighted average of 2.9%. Similarly, the statistical analysis conducted on geographies consisting of 472,823,945 people shows a slight negative correlation between the proportion of Immigrants from South Central Asia and percentage of population with hearing disability in the United States with a correlation coefficient (R) of -0.085 and weighted average of 2.6%, a difference of 11.7%.
Hearing Disability Correlation Summary
| Measurement | Subsaharan African | Immigrants from South Central Asia |
| Minimum | 1.3% | 0.44% |
| Maximum | 11.9% | 6.4% |
| Range | 10.6% | 5.9% |
| Mean | 3.5% | 2.3% |
| Median | 2.8% | 2.3% |
| Interquartile 25% (IQ1) | 2.5% | 1.8% |
| Interquartile 75% (IQ3) | 3.6% | 2.6% |
| Interquartile Range (IQR) | 1.0% | 0.81% |
| Standard Deviation (Sample) | 2.2% | 0.91% |
| Standard Deviation (Population) | 2.2% | 0.91% |
Similar Demographics by Hearing Disability
Demographics Similar to Sub-Saharan Africans by Hearing Disability
In terms of hearing disability, the demographic groups most similar to Sub-Saharan Africans are Immigrants from Jordan (2.9%, a difference of 0.070%), Bermudan (2.9%, a difference of 0.090%), Immigrants from Costa Rica (2.9%, a difference of 0.13%), Sri Lankan (2.9%, a difference of 0.14%), and Immigrants from Brazil (2.9%, a difference of 0.24%).
| Demographics | Rating | Rank | Hearing Disability |
| Ugandans | 85.5 /100 | #134 | Excellent 2.9% |
| Soviet Union | 84.8 /100 | #135 | Excellent 2.9% |
| Immigrants | Brazil | 84.6 /100 | #136 | Excellent 2.9% |
| Sri Lankans | 84.1 /100 | #137 | Excellent 2.9% |
| Immigrants | Costa Rica | 84.0 /100 | #138 | Excellent 2.9% |
| Bermudans | 83.8 /100 | #139 | Excellent 2.9% |
| Immigrants | Jordan | 83.7 /100 | #140 | Excellent 2.9% |
| Sub-Saharan Africans | 83.3 /100 | #141 | Excellent 2.9% |
| Laotians | 81.1 /100 | #142 | Excellent 2.9% |
| Immigrants | Bahamas | 80.9 /100 | #143 | Excellent 2.9% |
| Immigrants | Bulgaria | 79.2 /100 | #144 | Good 2.9% |
| Immigrants | Congo | 78.9 /100 | #145 | Good 2.9% |
| Brazilians | 78.7 /100 | #146 | Good 2.9% |
| Tongans | 78.6 /100 | #147 | Good 2.9% |
| Immigrants | Russia | 77.7 /100 | #148 | Good 2.9% |
Demographics Similar to Immigrants from South Central Asia by Hearing Disability
In terms of hearing disability, the demographic groups most similar to Immigrants from South Central Asia are Immigrants from Senegal (2.6%, a difference of 0.040%), Immigrants from El Salvador (2.6%, a difference of 0.050%), Immigrants from Haiti (2.6%, a difference of 0.37%), Bolivian (2.6%, a difference of 0.40%), and Immigrants from Ghana (2.6%, a difference of 0.45%).
| Demographics | Rating | Rank | Hearing Disability |
| Immigrants | Bolivia | 99.8 /100 | #20 | Exceptional 2.5% |
| Ghanaians | 99.8 /100 | #21 | Exceptional 2.5% |
| Immigrants | Sierra Leone | 99.8 /100 | #22 | Exceptional 2.6% |
| Immigrants | Nigeria | 99.8 /100 | #23 | Exceptional 2.6% |
| Immigrants | Ghana | 99.8 /100 | #24 | Exceptional 2.6% |
| Immigrants | El Salvador | 99.7 /100 | #25 | Exceptional 2.6% |
| Immigrants | Senegal | 99.7 /100 | #26 | Exceptional 2.6% |
| Immigrants | South Central Asia | 99.7 /100 | #27 | Exceptional 2.6% |
| Immigrants | Haiti | 99.7 /100 | #28 | Exceptional 2.6% |
| Bolivians | 99.7 /100 | #29 | Exceptional 2.6% |
| Immigrants | Caribbean | 99.7 /100 | #30 | Exceptional 2.6% |
| Immigrants | Cameroon | 99.7 /100 | #31 | Exceptional 2.6% |
| Immigrants | Venezuela | 99.7 /100 | #32 | Exceptional 2.6% |
| Filipinos | 99.6 /100 | #33 | Exceptional 2.6% |
| Immigrants | Pakistan | 99.6 /100 | #34 | Exceptional 2.6% |