Sri Lankan vs Sioux Disability Age 5 to 17
COMPARE
Sri Lankan
Sioux
Disability Age 5 to 17
Disability Age 5 to 17 Comparison
Sri Lankans
Sioux
5.2%
DISABILITY AGE 5 TO 17
99.6/ 100
METRIC RATING
80th/ 347
METRIC RANK
6.0%
DISABILITY AGE 5 TO 17
0.4/ 100
METRIC RATING
268th/ 347
METRIC RANK
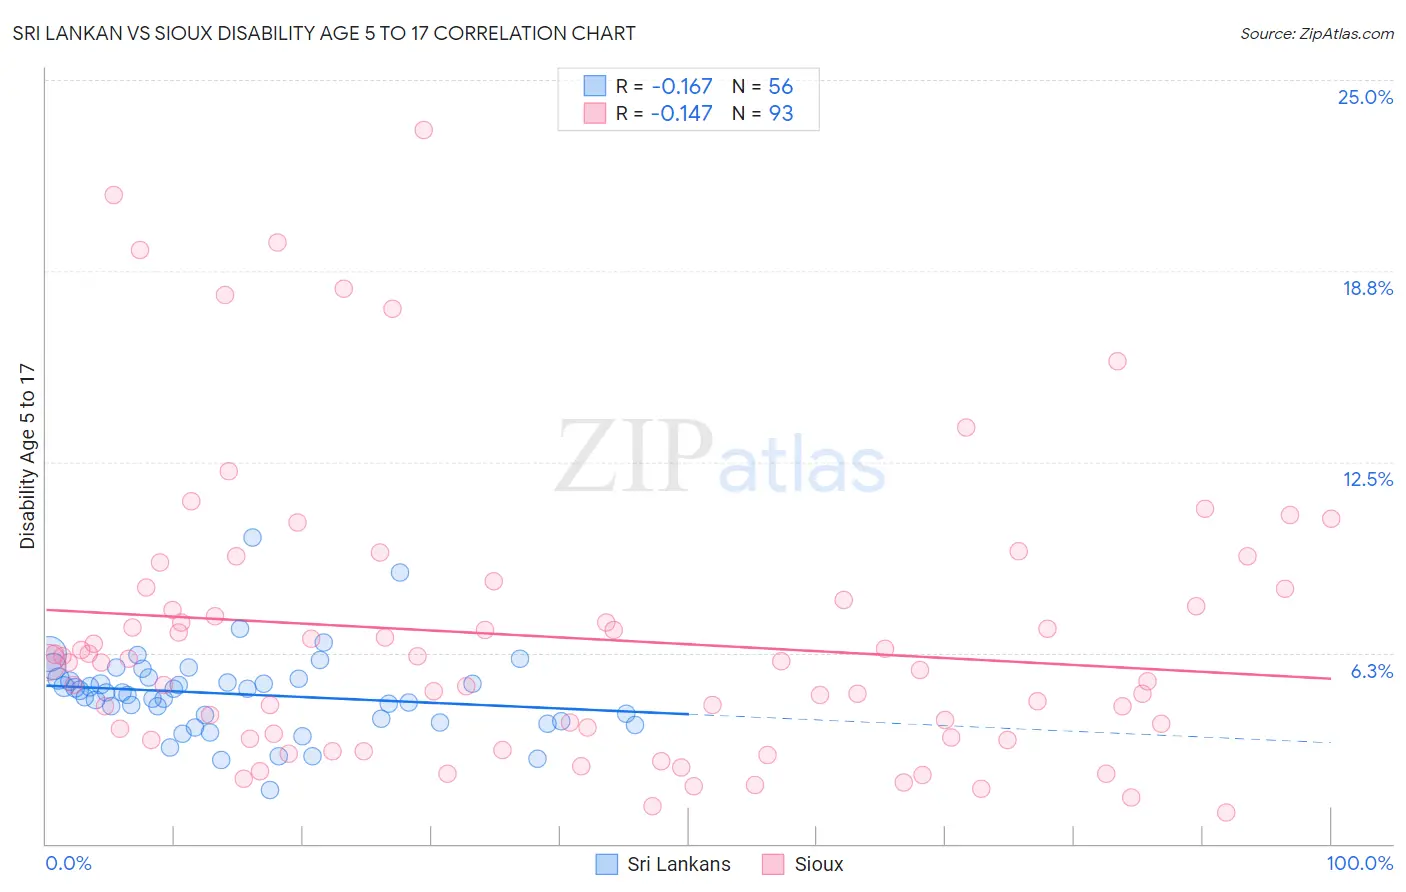
Sri Lankan vs Sioux Disability Age 5 to 17 Correlation Chart
The statistical analysis conducted on geographies consisting of 436,844,660 people shows a poor negative correlation between the proportion of Sri Lankans and percentage of population with a disability between the ages 5 and 17 in the United States with a correlation coefficient (R) of -0.167 and weighted average of 5.2%. Similarly, the statistical analysis conducted on geographies consisting of 232,872,632 people shows a poor negative correlation between the proportion of Sioux and percentage of population with a disability between the ages 5 and 17 in the United States with a correlation coefficient (R) of -0.147 and weighted average of 6.0%, a difference of 14.4%.
Disability Age 5 to 17 Correlation Summary
| Measurement | Sri Lankan | Sioux |
| Minimum | 1.8% | 1.0% |
| Maximum | 10.0% | 23.4% |
| Range | 8.3% | 22.4% |
| Mean | 4.9% | 6.8% |
| Median | 5.0% | 5.9% |
| Interquartile 25% (IQ1) | 4.0% | 3.5% |
| Interquartile 75% (IQ3) | 5.4% | 8.2% |
| Interquartile Range (IQR) | 1.4% | 4.7% |
| Standard Deviation (Sample) | 1.4% | 4.7% |
| Standard Deviation (Population) | 1.4% | 4.7% |
Similar Demographics by Disability Age 5 to 17
Demographics Similar to Sri Lankans by Disability Age 5 to 17
In terms of disability age 5 to 17, the demographic groups most similar to Sri Lankans are Afghan (5.2%, a difference of 0.020%), Native Hawaiian (5.2%, a difference of 0.040%), Immigrants from Cuba (5.2%, a difference of 0.060%), Immigrants from Kazakhstan (5.2%, a difference of 0.070%), and Immigrants from Guyana (5.2%, a difference of 0.10%).
| Demographics | Rating | Rank | Disability Age 5 to 17 |
| Immigrants | Czechoslovakia | 99.7 /100 | #73 | Exceptional 5.2% |
| Immigrants | Romania | 99.7 /100 | #74 | Exceptional 5.2% |
| Immigrants | Moldova | 99.6 /100 | #75 | Exceptional 5.2% |
| Immigrants | Guyana | 99.6 /100 | #76 | Exceptional 5.2% |
| Immigrants | Kazakhstan | 99.6 /100 | #77 | Exceptional 5.2% |
| Immigrants | Cuba | 99.6 /100 | #78 | Exceptional 5.2% |
| Afghans | 99.6 /100 | #79 | Exceptional 5.2% |
| Sri Lankans | 99.6 /100 | #80 | Exceptional 5.2% |
| Native Hawaiians | 99.6 /100 | #81 | Exceptional 5.2% |
| Immigrants | Sweden | 99.5 /100 | #82 | Exceptional 5.2% |
| Immigrants | France | 99.5 /100 | #83 | Exceptional 5.2% |
| Immigrants | Nicaragua | 99.5 /100 | #84 | Exceptional 5.2% |
| Bulgarians | 99.4 /100 | #85 | Exceptional 5.2% |
| Immigrants | St. Vincent and the Grenadines | 99.4 /100 | #86 | Exceptional 5.2% |
| Eastern Europeans | 99.4 /100 | #87 | Exceptional 5.2% |
Demographics Similar to Sioux by Disability Age 5 to 17
In terms of disability age 5 to 17, the demographic groups most similar to Sioux are Liberian (6.0%, a difference of 0.030%), Spanish (6.0%, a difference of 0.19%), Immigrants from Somalia (6.0%, a difference of 0.22%), Slovene (6.0%, a difference of 0.30%), and Panamanian (6.0%, a difference of 0.33%).
| Demographics | Rating | Rank | Disability Age 5 to 17 |
| Immigrants | Middle Africa | 0.7 /100 | #261 | Tragic 5.9% |
| Immigrants | Western Africa | 0.7 /100 | #262 | Tragic 5.9% |
| Czechoslovakians | 0.7 /100 | #263 | Tragic 5.9% |
| Canadians | 0.6 /100 | #264 | Tragic 6.0% |
| Panamanians | 0.6 /100 | #265 | Tragic 6.0% |
| Slovenes | 0.6 /100 | #266 | Tragic 6.0% |
| Spanish | 0.5 /100 | #267 | Tragic 6.0% |
| Sioux | 0.4 /100 | #268 | Tragic 6.0% |
| Liberians | 0.4 /100 | #269 | Tragic 6.0% |
| Immigrants | Somalia | 0.4 /100 | #270 | Tragic 6.0% |
| Immigrants | Zaire | 0.2 /100 | #271 | Tragic 6.0% |
| Finns | 0.2 /100 | #272 | Tragic 6.0% |
| Alaska Natives | 0.2 /100 | #273 | Tragic 6.0% |
| Cheyenne | 0.2 /100 | #274 | Tragic 6.0% |
| Dutch | 0.2 /100 | #275 | Tragic 6.0% |