Sri Lankan vs Sioux Median Household Income
COMPARE
Sri Lankan
Sioux
Median Household Income
Median Household Income Comparison
Sri Lankans
Sioux
$93,093
MEDIAN HOUSEHOLD INCOME
99.4/ 100
METRIC RATING
79th/ 347
METRIC RANK
$67,792
MEDIAN HOUSEHOLD INCOME
0.0/ 100
METRIC RATING
332nd/ 347
METRIC RANK
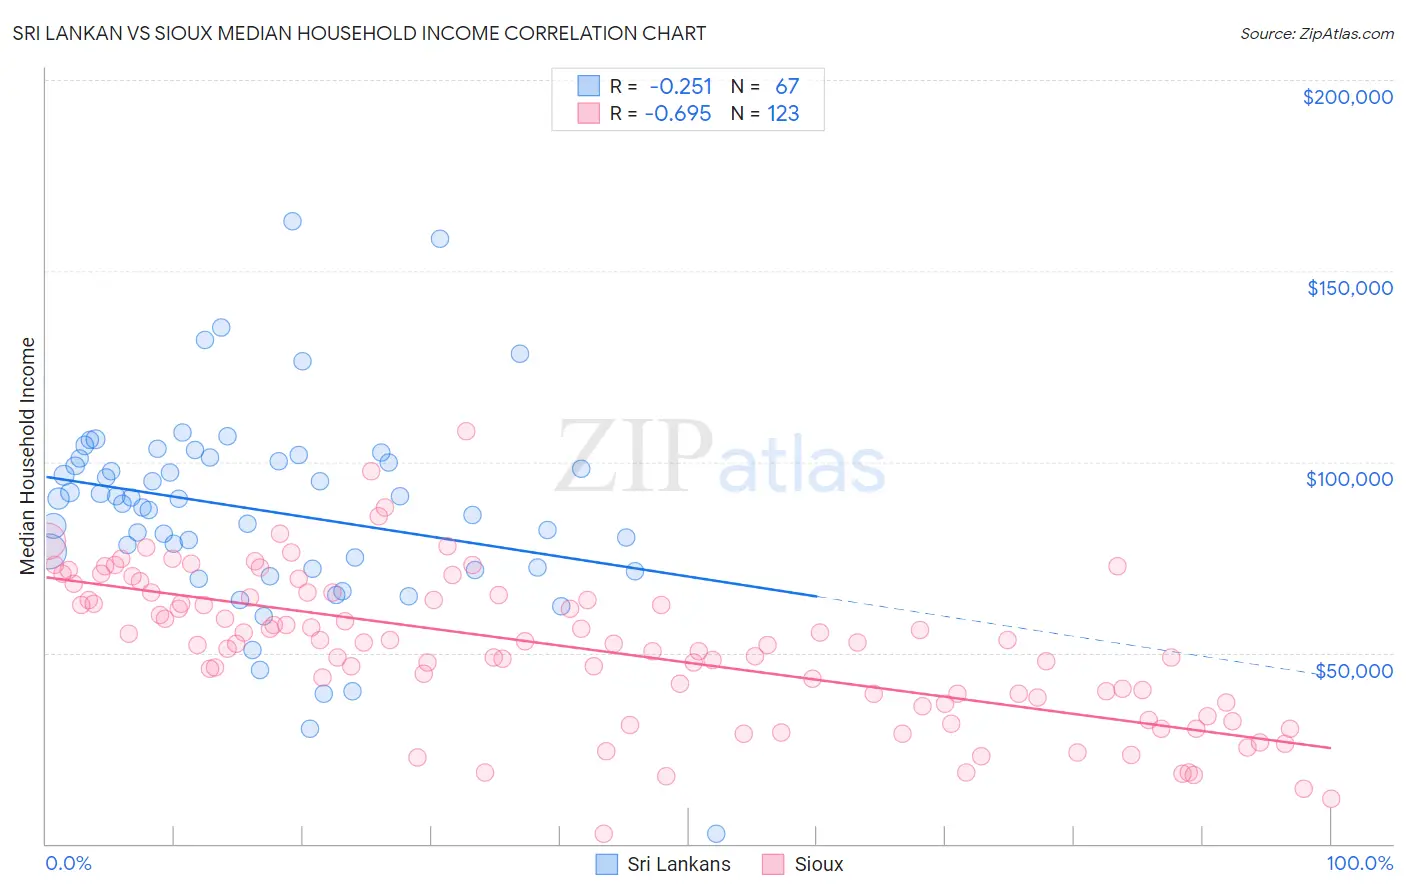
Sri Lankan vs Sioux Median Household Income Correlation Chart
The statistical analysis conducted on geographies consisting of 439,964,424 people shows a weak negative correlation between the proportion of Sri Lankans and median household income in the United States with a correlation coefficient (R) of -0.251 and weighted average of $93,093. Similarly, the statistical analysis conducted on geographies consisting of 234,052,794 people shows a significant negative correlation between the proportion of Sioux and median household income in the United States with a correlation coefficient (R) of -0.695 and weighted average of $67,792, a difference of 37.3%.
Median Household Income Correlation Summary
| Measurement | Sri Lankan | Sioux |
| Minimum | $2,499 | $2,499 |
| Maximum | $163,019 | $108,000 |
| Range | $160,520 | $105,501 |
| Mean | $87,249 | $51,141 |
| Median | $90,272 | $52,399 |
| Interquartile 25% (IQ1) | $71,944 | $36,923 |
| Interquartile 75% (IQ3) | $100,934 | $65,000 |
| Interquartile Range (IQR) | $28,990 | $28,077 |
| Standard Deviation (Sample) | $26,489 | $19,497 |
| Standard Deviation (Population) | $26,291 | $19,417 |
Similar Demographics by Median Household Income
Demographics Similar to Sri Lankans by Median Household Income
In terms of median household income, the demographic groups most similar to Sri Lankans are Tongan ($93,076, a difference of 0.020%), Immigrants from Eastern Europe ($93,051, a difference of 0.050%), Immigrants from Bulgaria ($93,148, a difference of 0.060%), Immigrants from Afghanistan ($93,375, a difference of 0.30%), and South African ($93,379, a difference of 0.31%).
| Demographics | Rating | Rank | Median Household Income |
| Lithuanians | 99.6 /100 | #72 | Exceptional $93,852 |
| Immigrants | Egypt | 99.6 /100 | #73 | Exceptional $93,700 |
| Immigrants | Latvia | 99.6 /100 | #74 | Exceptional $93,602 |
| Immigrants | Italy | 99.5 /100 | #75 | Exceptional $93,465 |
| South Africans | 99.5 /100 | #76 | Exceptional $93,379 |
| Immigrants | Afghanistan | 99.5 /100 | #77 | Exceptional $93,375 |
| Immigrants | Bulgaria | 99.4 /100 | #78 | Exceptional $93,148 |
| Sri Lankans | 99.4 /100 | #79 | Exceptional $93,093 |
| Tongans | 99.4 /100 | #80 | Exceptional $93,076 |
| Immigrants | Eastern Europe | 99.4 /100 | #81 | Exceptional $93,051 |
| Immigrants | Spain | 99.3 /100 | #82 | Exceptional $92,732 |
| Italians | 99.1 /100 | #83 | Exceptional $92,475 |
| Immigrants | Argentina | 99.1 /100 | #84 | Exceptional $92,417 |
| Immigrants | Croatia | 99.0 /100 | #85 | Exceptional $92,225 |
| Immigrants | England | 98.9 /100 | #86 | Exceptional $92,098 |
Demographics Similar to Sioux by Median Household Income
In terms of median household income, the demographic groups most similar to Sioux are Creek ($67,715, a difference of 0.11%), Native/Alaskan ($67,879, a difference of 0.13%), Arapaho ($67,965, a difference of 0.25%), Black/African American ($67,573, a difference of 0.32%), and Dutch West Indian ($68,412, a difference of 0.91%).
| Demographics | Rating | Rank | Median Household Income |
| Seminole | 0.0 /100 | #325 | Tragic $69,420 |
| Yuman | 0.0 /100 | #326 | Tragic $68,743 |
| Immigrants | Cuba | 0.0 /100 | #327 | Tragic $68,461 |
| Menominee | 0.0 /100 | #328 | Tragic $68,423 |
| Dutch West Indians | 0.0 /100 | #329 | Tragic $68,412 |
| Arapaho | 0.0 /100 | #330 | Tragic $67,965 |
| Natives/Alaskans | 0.0 /100 | #331 | Tragic $67,879 |
| Sioux | 0.0 /100 | #332 | Tragic $67,792 |
| Creek | 0.0 /100 | #333 | Tragic $67,715 |
| Blacks/African Americans | 0.0 /100 | #334 | Tragic $67,573 |
| Cheyenne | 0.0 /100 | #335 | Tragic $66,974 |
| Immigrants | Congo | 0.0 /100 | #336 | Tragic $66,768 |
| Kiowa | 0.0 /100 | #337 | Tragic $65,914 |
| Immigrants | Yemen | 0.0 /100 | #338 | Tragic $65,194 |
| Hopi | 0.0 /100 | #339 | Tragic $65,043 |