South African vs Sioux Cognitive Disability
COMPARE
South African
Sioux
Cognitive Disability
Cognitive Disability Comparison
South Africans
Sioux
16.9%
COGNITIVE DISABILITY
95.5/ 100
METRIC RATING
119th/ 347
METRIC RANK
17.3%
COGNITIVE DISABILITY
48.6/ 100
METRIC RATING
179th/ 347
METRIC RANK
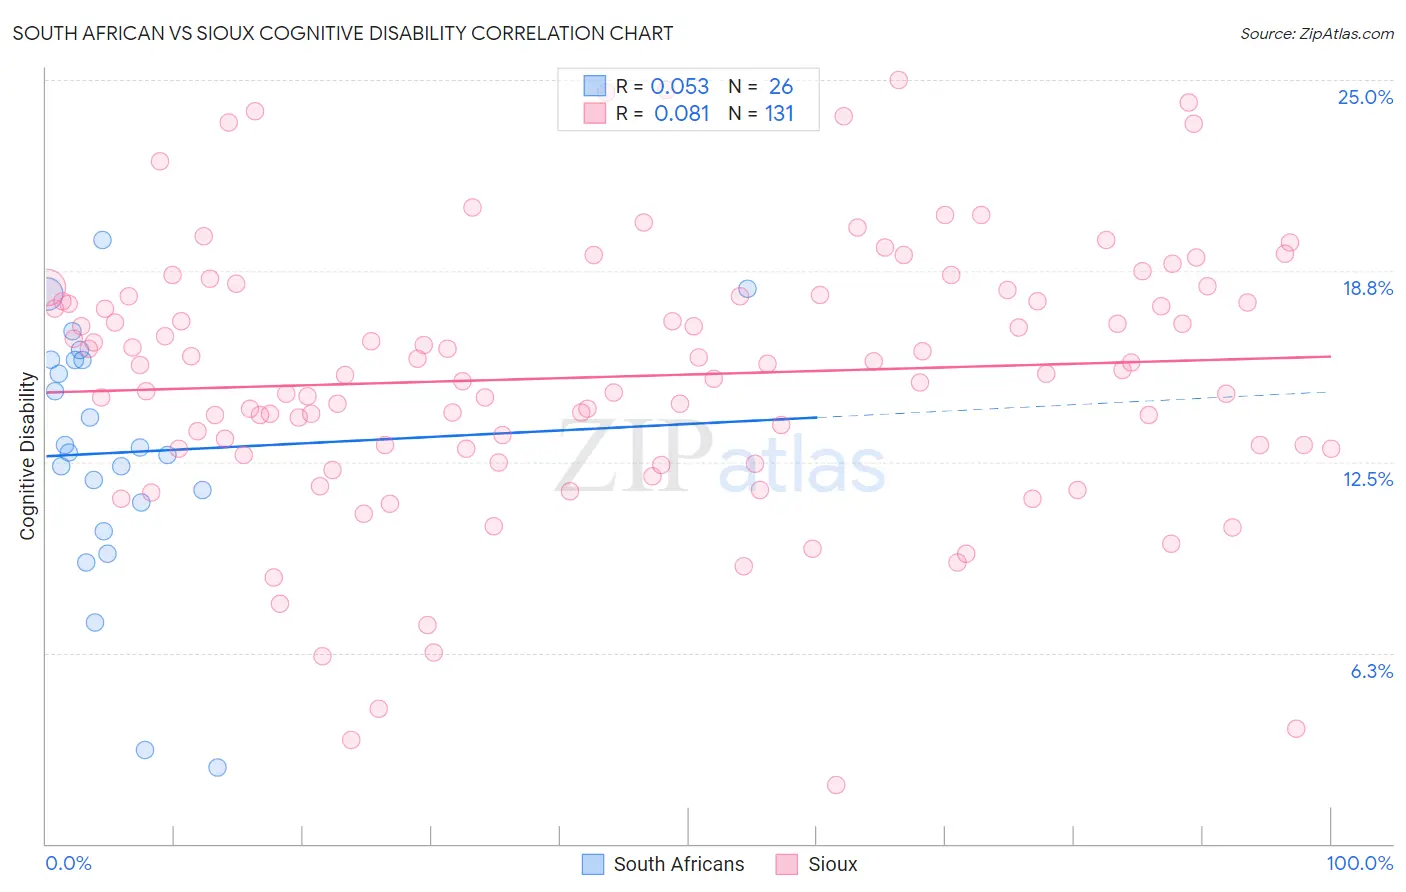
South African vs Sioux Cognitive Disability Correlation Chart
The statistical analysis conducted on geographies consisting of 182,593,753 people shows a slight positive correlation between the proportion of South Africans and percentage of population with cognitive disability in the United States with a correlation coefficient (R) of 0.053 and weighted average of 16.9%. Similarly, the statistical analysis conducted on geographies consisting of 234,153,820 people shows a slight positive correlation between the proportion of Sioux and percentage of population with cognitive disability in the United States with a correlation coefficient (R) of 0.081 and weighted average of 17.3%, a difference of 2.3%.
Cognitive Disability Correlation Summary
| Measurement | South African | Sioux |
| Minimum | 2.5% | 1.9% |
| Maximum | 19.8% | 25.0% |
| Range | 17.3% | 23.1% |
| Mean | 12.8% | 15.3% |
| Median | 12.9% | 15.5% |
| Interquartile 25% (IQ1) | 11.2% | 12.9% |
| Interquartile 75% (IQ3) | 15.8% | 17.9% |
| Interquartile Range (IQR) | 4.7% | 5.0% |
| Standard Deviation (Sample) | 4.2% | 4.4% |
| Standard Deviation (Population) | 4.1% | 4.4% |
Similar Demographics by Cognitive Disability
Demographics Similar to South Africans by Cognitive Disability
In terms of cognitive disability, the demographic groups most similar to South Africans are Scottish (16.9%, a difference of 0.080%), Immigrants from China (16.9%, a difference of 0.10%), Immigrants from Western Europe (16.9%, a difference of 0.12%), Immigrants from Japan (16.9%, a difference of 0.13%), and Immigrants from Denmark (16.9%, a difference of 0.13%).
| Demographics | Rating | Rank | Cognitive Disability |
| Indians (Asian) | 97.2 /100 | #112 | Exceptional 16.8% |
| Immigrants | Sri Lanka | 97.1 /100 | #113 | Exceptional 16.8% |
| Koreans | 97.1 /100 | #114 | Exceptional 16.8% |
| Yup'ik | 96.9 /100 | #115 | Exceptional 16.9% |
| Inupiat | 96.5 /100 | #116 | Exceptional 16.9% |
| Immigrants | Japan | 96.2 /100 | #117 | Exceptional 16.9% |
| Immigrants | Denmark | 96.2 /100 | #118 | Exceptional 16.9% |
| South Africans | 95.5 /100 | #119 | Exceptional 16.9% |
| Scottish | 95.0 /100 | #120 | Exceptional 16.9% |
| Immigrants | China | 94.9 /100 | #121 | Exceptional 16.9% |
| Immigrants | Western Europe | 94.8 /100 | #122 | Exceptional 16.9% |
| Portuguese | 94.7 /100 | #123 | Exceptional 16.9% |
| Turks | 94.5 /100 | #124 | Exceptional 16.9% |
| Scandinavians | 94.1 /100 | #125 | Exceptional 16.9% |
| Europeans | 93.4 /100 | #126 | Exceptional 17.0% |
Demographics Similar to Sioux by Cognitive Disability
In terms of cognitive disability, the demographic groups most similar to Sioux are Ute (17.3%, a difference of 0.010%), Spanish (17.3%, a difference of 0.010%), Shoshone (17.3%, a difference of 0.020%), Tsimshian (17.3%, a difference of 0.030%), and Laotian (17.3%, a difference of 0.040%).
| Demographics | Rating | Rank | Cognitive Disability |
| Immigrants | Turkey | 56.7 /100 | #172 | Average 17.2% |
| Immigrants | Northern Africa | 50.2 /100 | #173 | Average 17.3% |
| Laotians | 50.0 /100 | #174 | Average 17.3% |
| Tsimshian | 49.8 /100 | #175 | Average 17.3% |
| Shoshone | 49.2 /100 | #176 | Average 17.3% |
| Ute | 49.1 /100 | #177 | Average 17.3% |
| Spanish | 48.9 /100 | #178 | Average 17.3% |
| Sioux | 48.6 /100 | #179 | Average 17.3% |
| Pakistanis | 43.9 /100 | #180 | Average 17.3% |
| Immigrants | Guyana | 42.9 /100 | #181 | Average 17.3% |
| Arabs | 42.8 /100 | #182 | Average 17.3% |
| Spaniards | 40.3 /100 | #183 | Average 17.3% |
| Crow | 39.1 /100 | #184 | Fair 17.3% |
| Afghans | 38.2 /100 | #185 | Fair 17.3% |
| Cambodians | 35.9 /100 | #186 | Fair 17.3% |