Haitian vs Sioux Cognitive Disability
COMPARE
Haitian
Sioux
Cognitive Disability
Cognitive Disability Comparison
Haitians
Sioux
17.5%
COGNITIVE DISABILITY
14.1/ 100
METRIC RATING
200th/ 347
METRIC RANK
17.3%
COGNITIVE DISABILITY
48.6/ 100
METRIC RATING
179th/ 347
METRIC RANK
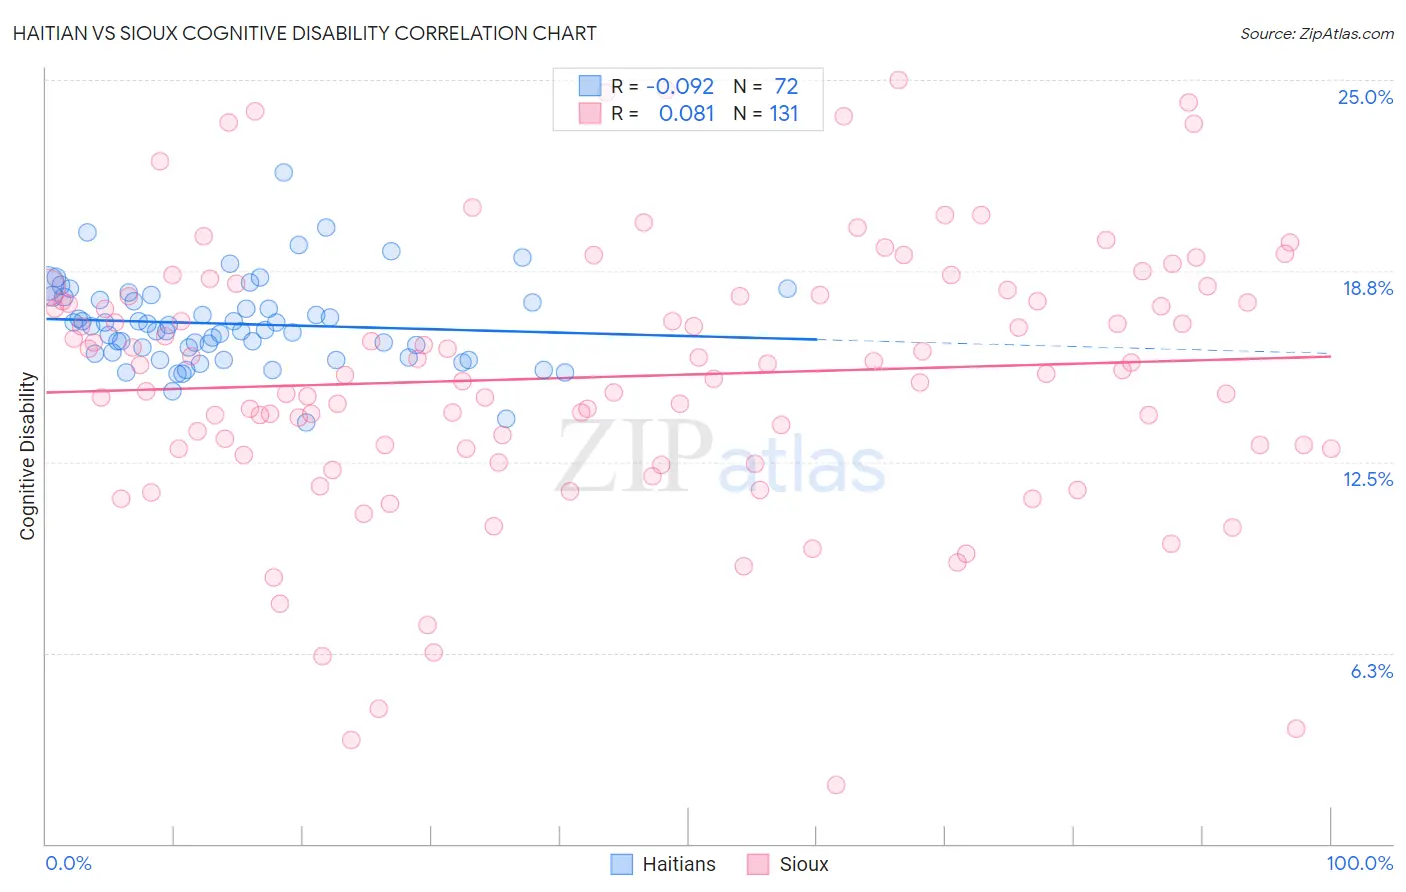
Haitian vs Sioux Cognitive Disability Correlation Chart
The statistical analysis conducted on geographies consisting of 287,929,830 people shows a slight negative correlation between the proportion of Haitians and percentage of population with cognitive disability in the United States with a correlation coefficient (R) of -0.092 and weighted average of 17.5%. Similarly, the statistical analysis conducted on geographies consisting of 234,153,820 people shows a slight positive correlation between the proportion of Sioux and percentage of population with cognitive disability in the United States with a correlation coefficient (R) of 0.081 and weighted average of 17.3%, a difference of 1.3%.
Cognitive Disability Correlation Summary
| Measurement | Haitian | Sioux |
| Minimum | 13.8% | 1.9% |
| Maximum | 22.0% | 25.0% |
| Range | 8.2% | 23.1% |
| Mean | 17.0% | 15.3% |
| Median | 16.9% | 15.5% |
| Interquartile 25% (IQ1) | 16.1% | 12.9% |
| Interquartile 75% (IQ3) | 17.8% | 17.9% |
| Interquartile Range (IQR) | 1.8% | 5.0% |
| Standard Deviation (Sample) | 1.4% | 4.4% |
| Standard Deviation (Population) | 1.4% | 4.4% |
Similar Demographics by Cognitive Disability
Demographics Similar to Haitians by Cognitive Disability
In terms of cognitive disability, the demographic groups most similar to Haitians are Immigrants from Singapore (17.5%, a difference of 0.010%), Immigrants from Panama (17.5%, a difference of 0.040%), South American Indian (17.5%, a difference of 0.070%), Immigrants from Morocco (17.5%, a difference of 0.13%), and Immigrants from Afghanistan (17.5%, a difference of 0.14%).
| Demographics | Rating | Rank | Cognitive Disability |
| Delaware | 25.6 /100 | #193 | Fair 17.4% |
| Immigrants | Bosnia and Herzegovina | 22.0 /100 | #194 | Fair 17.4% |
| New Zealanders | 21.1 /100 | #195 | Fair 17.4% |
| Guyanese | 17.5 /100 | #196 | Poor 17.5% |
| Immigrants | Afghanistan | 16.7 /100 | #197 | Poor 17.5% |
| Immigrants | Panama | 14.8 /100 | #198 | Poor 17.5% |
| Immigrants | Singapore | 14.3 /100 | #199 | Poor 17.5% |
| Haitians | 14.1 /100 | #200 | Poor 17.5% |
| South American Indians | 13.0 /100 | #201 | Poor 17.5% |
| Immigrants | Morocco | 12.0 /100 | #202 | Poor 17.5% |
| Immigrants | Caribbean | 11.0 /100 | #203 | Poor 17.5% |
| Immigrants | Zimbabwe | 11.0 /100 | #204 | Poor 17.5% |
| Puget Sound Salish | 10.9 /100 | #205 | Poor 17.5% |
| Alaska Natives | 10.4 /100 | #206 | Poor 17.5% |
| Immigrants | Latin America | 9.7 /100 | #207 | Tragic 17.6% |
Demographics Similar to Sioux by Cognitive Disability
In terms of cognitive disability, the demographic groups most similar to Sioux are Ute (17.3%, a difference of 0.010%), Spanish (17.3%, a difference of 0.010%), Shoshone (17.3%, a difference of 0.020%), Tsimshian (17.3%, a difference of 0.030%), and Laotian (17.3%, a difference of 0.040%).
| Demographics | Rating | Rank | Cognitive Disability |
| Immigrants | Turkey | 56.7 /100 | #172 | Average 17.2% |
| Immigrants | Northern Africa | 50.2 /100 | #173 | Average 17.3% |
| Laotians | 50.0 /100 | #174 | Average 17.3% |
| Tsimshian | 49.8 /100 | #175 | Average 17.3% |
| Shoshone | 49.2 /100 | #176 | Average 17.3% |
| Ute | 49.1 /100 | #177 | Average 17.3% |
| Spanish | 48.9 /100 | #178 | Average 17.3% |
| Sioux | 48.6 /100 | #179 | Average 17.3% |
| Pakistanis | 43.9 /100 | #180 | Average 17.3% |
| Immigrants | Guyana | 42.9 /100 | #181 | Average 17.3% |
| Arabs | 42.8 /100 | #182 | Average 17.3% |
| Spaniards | 40.3 /100 | #183 | Average 17.3% |
| Crow | 39.1 /100 | #184 | Fair 17.3% |
| Afghans | 38.2 /100 | #185 | Fair 17.3% |
| Cambodians | 35.9 /100 | #186 | Fair 17.3% |