South African vs Immigrants from Trinidad and Tobago Cognitive Disability
COMPARE
South African
Immigrants from Trinidad and Tobago
Cognitive Disability
Cognitive Disability Comparison
South Africans
Immigrants from Trinidad and Tobago
16.9%
COGNITIVE DISABILITY
95.5/ 100
METRIC RATING
119th/ 347
METRIC RANK
17.6%
COGNITIVE DISABILITY
8.7/ 100
METRIC RATING
209th/ 347
METRIC RANK
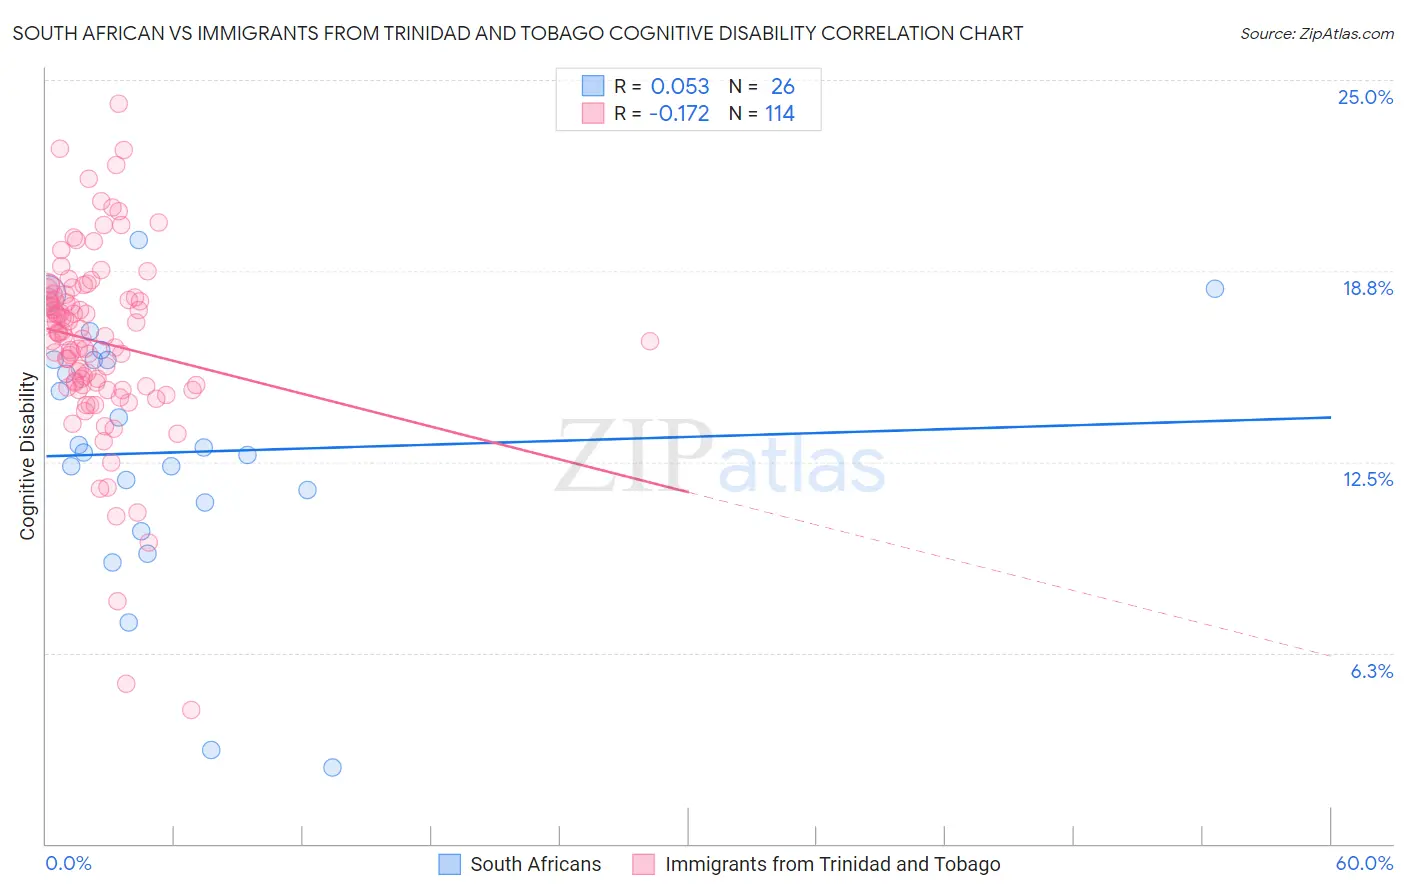
South African vs Immigrants from Trinidad and Tobago Cognitive Disability Correlation Chart
The statistical analysis conducted on geographies consisting of 182,593,753 people shows a slight positive correlation between the proportion of South Africans and percentage of population with cognitive disability in the United States with a correlation coefficient (R) of 0.053 and weighted average of 16.9%. Similarly, the statistical analysis conducted on geographies consisting of 223,500,397 people shows a poor negative correlation between the proportion of Immigrants from Trinidad and Tobago and percentage of population with cognitive disability in the United States with a correlation coefficient (R) of -0.172 and weighted average of 17.6%, a difference of 3.9%.
Cognitive Disability Correlation Summary
| Measurement | South African | Immigrants from Trinidad and Tobago |
| Minimum | 2.5% | 4.4% |
| Maximum | 19.8% | 24.2% |
| Range | 17.3% | 19.8% |
| Mean | 12.8% | 16.4% |
| Median | 12.9% | 16.7% |
| Interquartile 25% (IQ1) | 11.2% | 15.0% |
| Interquartile 75% (IQ3) | 15.8% | 17.9% |
| Interquartile Range (IQR) | 4.7% | 2.9% |
| Standard Deviation (Sample) | 4.2% | 3.0% |
| Standard Deviation (Population) | 4.1% | 3.0% |
Similar Demographics by Cognitive Disability
Demographics Similar to South Africans by Cognitive Disability
In terms of cognitive disability, the demographic groups most similar to South Africans are Scottish (16.9%, a difference of 0.080%), Immigrants from China (16.9%, a difference of 0.10%), Immigrants from Western Europe (16.9%, a difference of 0.12%), Immigrants from Japan (16.9%, a difference of 0.13%), and Immigrants from Denmark (16.9%, a difference of 0.13%).
| Demographics | Rating | Rank | Cognitive Disability |
| Indians (Asian) | 97.2 /100 | #112 | Exceptional 16.8% |
| Immigrants | Sri Lanka | 97.1 /100 | #113 | Exceptional 16.8% |
| Koreans | 97.1 /100 | #114 | Exceptional 16.8% |
| Yup'ik | 96.9 /100 | #115 | Exceptional 16.9% |
| Inupiat | 96.5 /100 | #116 | Exceptional 16.9% |
| Immigrants | Japan | 96.2 /100 | #117 | Exceptional 16.9% |
| Immigrants | Denmark | 96.2 /100 | #118 | Exceptional 16.9% |
| South Africans | 95.5 /100 | #119 | Exceptional 16.9% |
| Scottish | 95.0 /100 | #120 | Exceptional 16.9% |
| Immigrants | China | 94.9 /100 | #121 | Exceptional 16.9% |
| Immigrants | Western Europe | 94.8 /100 | #122 | Exceptional 16.9% |
| Portuguese | 94.7 /100 | #123 | Exceptional 16.9% |
| Turks | 94.5 /100 | #124 | Exceptional 16.9% |
| Scandinavians | 94.1 /100 | #125 | Exceptional 16.9% |
| Europeans | 93.4 /100 | #126 | Exceptional 17.0% |
Demographics Similar to Immigrants from Trinidad and Tobago by Cognitive Disability
In terms of cognitive disability, the demographic groups most similar to Immigrants from Trinidad and Tobago are Immigrants from Jamaica (17.6%, a difference of 0.020%), Immigrants from Cameroon (17.6%, a difference of 0.050%), Immigrants from Latin America (17.6%, a difference of 0.080%), Taiwanese (17.6%, a difference of 0.090%), and Alaska Native (17.5%, a difference of 0.13%).
| Demographics | Rating | Rank | Cognitive Disability |
| Immigrants | Morocco | 12.0 /100 | #202 | Poor 17.5% |
| Immigrants | Caribbean | 11.0 /100 | #203 | Poor 17.5% |
| Immigrants | Zimbabwe | 11.0 /100 | #204 | Poor 17.5% |
| Puget Sound Salish | 10.9 /100 | #205 | Poor 17.5% |
| Alaska Natives | 10.4 /100 | #206 | Poor 17.5% |
| Immigrants | Latin America | 9.7 /100 | #207 | Tragic 17.6% |
| Immigrants | Cameroon | 9.3 /100 | #208 | Tragic 17.6% |
| Immigrants | Trinidad and Tobago | 8.7 /100 | #209 | Tragic 17.6% |
| Immigrants | Jamaica | 8.5 /100 | #210 | Tragic 17.6% |
| Taiwanese | 7.7 /100 | #211 | Tragic 17.6% |
| Immigrants | Oceania | 7.3 /100 | #212 | Tragic 17.6% |
| Hawaiians | 7.2 /100 | #213 | Tragic 17.6% |
| Immigrants | El Salvador | 7.0 /100 | #214 | Tragic 17.6% |
| Alaskan Athabascans | 6.9 /100 | #215 | Tragic 17.6% |
| Okinawans | 6.8 /100 | #216 | Tragic 17.6% |