South African vs Immigrants from Lebanon Cognitive Disability
COMPARE
South African
Immigrants from Lebanon
Cognitive Disability
Cognitive Disability Comparison
South Africans
Immigrants from Lebanon
16.9%
COGNITIVE DISABILITY
95.5/ 100
METRIC RATING
119th/ 347
METRIC RANK
16.8%
COGNITIVE DISABILITY
98.4/ 100
METRIC RATING
98th/ 347
METRIC RANK
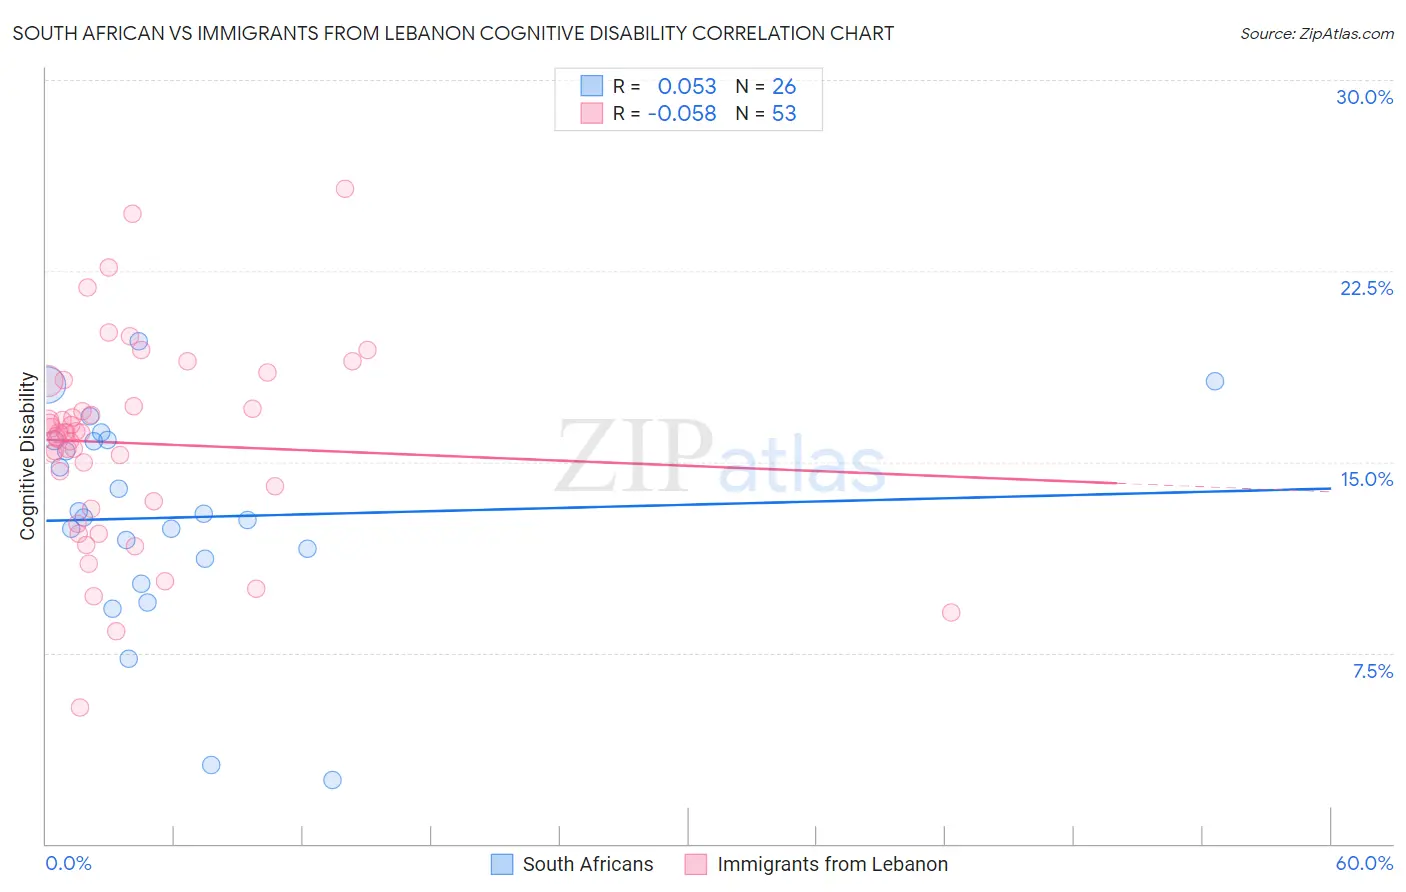
South African vs Immigrants from Lebanon Cognitive Disability Correlation Chart
The statistical analysis conducted on geographies consisting of 182,593,753 people shows a slight positive correlation between the proportion of South Africans and percentage of population with cognitive disability in the United States with a correlation coefficient (R) of 0.053 and weighted average of 16.9%. Similarly, the statistical analysis conducted on geographies consisting of 217,153,550 people shows a slight negative correlation between the proportion of Immigrants from Lebanon and percentage of population with cognitive disability in the United States with a correlation coefficient (R) of -0.058 and weighted average of 16.8%, a difference of 0.79%.
Cognitive Disability Correlation Summary
| Measurement | South African | Immigrants from Lebanon |
| Minimum | 2.5% | 5.4% |
| Maximum | 19.8% | 25.7% |
| Range | 17.3% | 20.3% |
| Mean | 12.8% | 15.7% |
| Median | 12.9% | 16.1% |
| Interquartile 25% (IQ1) | 11.2% | 13.3% |
| Interquartile 75% (IQ3) | 15.8% | 17.7% |
| Interquartile Range (IQR) | 4.7% | 4.4% |
| Standard Deviation (Sample) | 4.2% | 3.9% |
| Standard Deviation (Population) | 4.1% | 3.9% |
Similar Demographics by Cognitive Disability
Demographics Similar to South Africans by Cognitive Disability
In terms of cognitive disability, the demographic groups most similar to South Africans are Scottish (16.9%, a difference of 0.080%), Immigrants from China (16.9%, a difference of 0.10%), Immigrants from Western Europe (16.9%, a difference of 0.12%), Immigrants from Japan (16.9%, a difference of 0.13%), and Immigrants from Denmark (16.9%, a difference of 0.13%).
| Demographics | Rating | Rank | Cognitive Disability |
| Indians (Asian) | 97.2 /100 | #112 | Exceptional 16.8% |
| Immigrants | Sri Lanka | 97.1 /100 | #113 | Exceptional 16.8% |
| Koreans | 97.1 /100 | #114 | Exceptional 16.8% |
| Yup'ik | 96.9 /100 | #115 | Exceptional 16.9% |
| Inupiat | 96.5 /100 | #116 | Exceptional 16.9% |
| Immigrants | Japan | 96.2 /100 | #117 | Exceptional 16.9% |
| Immigrants | Denmark | 96.2 /100 | #118 | Exceptional 16.9% |
| South Africans | 95.5 /100 | #119 | Exceptional 16.9% |
| Scottish | 95.0 /100 | #120 | Exceptional 16.9% |
| Immigrants | China | 94.9 /100 | #121 | Exceptional 16.9% |
| Immigrants | Western Europe | 94.8 /100 | #122 | Exceptional 16.9% |
| Portuguese | 94.7 /100 | #123 | Exceptional 16.9% |
| Turks | 94.5 /100 | #124 | Exceptional 16.9% |
| Scandinavians | 94.1 /100 | #125 | Exceptional 16.9% |
| Europeans | 93.4 /100 | #126 | Exceptional 17.0% |
Demographics Similar to Immigrants from Lebanon by Cognitive Disability
In terms of cognitive disability, the demographic groups most similar to Immigrants from Lebanon are Dutch (16.8%, a difference of 0.020%), Finnish (16.8%, a difference of 0.040%), English (16.8%, a difference of 0.060%), Jordanian (16.8%, a difference of 0.090%), and Asian (16.7%, a difference of 0.12%).
| Demographics | Rating | Rank | Cognitive Disability |
| Danes | 98.8 /100 | #91 | Exceptional 16.7% |
| Immigrants | South America | 98.8 /100 | #92 | Exceptional 16.7% |
| Immigrants | Southern Europe | 98.7 /100 | #93 | Exceptional 16.7% |
| Asians | 98.7 /100 | #94 | Exceptional 16.7% |
| English | 98.6 /100 | #95 | Exceptional 16.8% |
| Finns | 98.5 /100 | #96 | Exceptional 16.8% |
| Dutch | 98.5 /100 | #97 | Exceptional 16.8% |
| Immigrants | Lebanon | 98.4 /100 | #98 | Exceptional 16.8% |
| Jordanians | 98.2 /100 | #99 | Exceptional 16.8% |
| Immigrants | Russia | 98.2 /100 | #100 | Exceptional 16.8% |
| Immigrants | Asia | 98.1 /100 | #101 | Exceptional 16.8% |
| Irish | 98.1 /100 | #102 | Exceptional 16.8% |
| Paraguayans | 98.0 /100 | #103 | Exceptional 16.8% |
| Palestinians | 98.0 /100 | #104 | Exceptional 16.8% |
| Immigrants | Eastern Asia | 97.9 /100 | #105 | Exceptional 16.8% |