South African vs Immigrants from Armenia Cognitive Disability
COMPARE
South African
Immigrants from Armenia
Cognitive Disability
Cognitive Disability Comparison
South Africans
Immigrants from Armenia
16.9%
COGNITIVE DISABILITY
95.5/ 100
METRIC RATING
119th/ 347
METRIC RANK
17.9%
COGNITIVE DISABILITY
0.6/ 100
METRIC RATING
258th/ 347
METRIC RANK
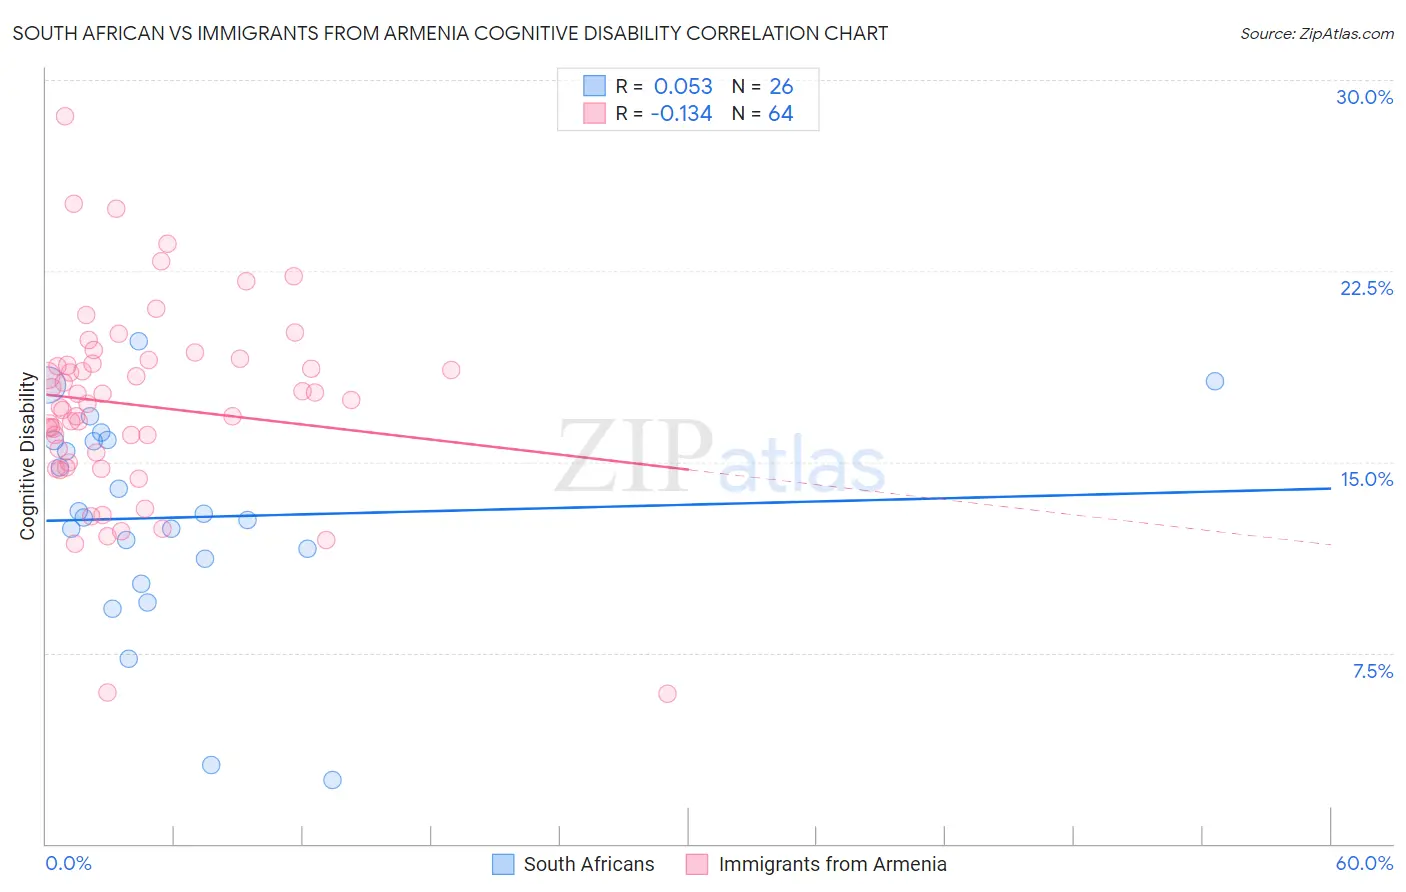
South African vs Immigrants from Armenia Cognitive Disability Correlation Chart
The statistical analysis conducted on geographies consisting of 182,593,753 people shows a slight positive correlation between the proportion of South Africans and percentage of population with cognitive disability in the United States with a correlation coefficient (R) of 0.053 and weighted average of 16.9%. Similarly, the statistical analysis conducted on geographies consisting of 97,717,666 people shows a poor negative correlation between the proportion of Immigrants from Armenia and percentage of population with cognitive disability in the United States with a correlation coefficient (R) of -0.134 and weighted average of 17.9%, a difference of 6.0%.
Cognitive Disability Correlation Summary
| Measurement | South African | Immigrants from Armenia |
| Minimum | 2.5% | 5.9% |
| Maximum | 19.8% | 28.6% |
| Range | 17.3% | 22.7% |
| Mean | 12.8% | 17.2% |
| Median | 12.9% | 17.4% |
| Interquartile 25% (IQ1) | 11.2% | 15.2% |
| Interquartile 75% (IQ3) | 15.8% | 18.9% |
| Interquartile Range (IQR) | 4.7% | 3.8% |
| Standard Deviation (Sample) | 4.2% | 3.9% |
| Standard Deviation (Population) | 4.1% | 3.9% |
Similar Demographics by Cognitive Disability
Demographics Similar to South Africans by Cognitive Disability
In terms of cognitive disability, the demographic groups most similar to South Africans are Scottish (16.9%, a difference of 0.080%), Immigrants from China (16.9%, a difference of 0.10%), Immigrants from Western Europe (16.9%, a difference of 0.12%), Immigrants from Japan (16.9%, a difference of 0.13%), and Immigrants from Denmark (16.9%, a difference of 0.13%).
| Demographics | Rating | Rank | Cognitive Disability |
| Indians (Asian) | 97.2 /100 | #112 | Exceptional 16.8% |
| Immigrants | Sri Lanka | 97.1 /100 | #113 | Exceptional 16.8% |
| Koreans | 97.1 /100 | #114 | Exceptional 16.8% |
| Yup'ik | 96.9 /100 | #115 | Exceptional 16.9% |
| Inupiat | 96.5 /100 | #116 | Exceptional 16.9% |
| Immigrants | Japan | 96.2 /100 | #117 | Exceptional 16.9% |
| Immigrants | Denmark | 96.2 /100 | #118 | Exceptional 16.9% |
| South Africans | 95.5 /100 | #119 | Exceptional 16.9% |
| Scottish | 95.0 /100 | #120 | Exceptional 16.9% |
| Immigrants | China | 94.9 /100 | #121 | Exceptional 16.9% |
| Immigrants | Western Europe | 94.8 /100 | #122 | Exceptional 16.9% |
| Portuguese | 94.7 /100 | #123 | Exceptional 16.9% |
| Turks | 94.5 /100 | #124 | Exceptional 16.9% |
| Scandinavians | 94.1 /100 | #125 | Exceptional 16.9% |
| Europeans | 93.4 /100 | #126 | Exceptional 17.0% |
Demographics Similar to Immigrants from Armenia by Cognitive Disability
In terms of cognitive disability, the demographic groups most similar to Immigrants from Armenia are Mexican American Indian (17.9%, a difference of 0.010%), Immigrants from the Azores (17.9%, a difference of 0.050%), Bahamian (17.9%, a difference of 0.050%), Hopi (17.9%, a difference of 0.060%), and Hispanic or Latino (17.9%, a difference of 0.060%).
| Demographics | Rating | Rank | Cognitive Disability |
| Malaysians | 0.6 /100 | #251 | Tragic 17.9% |
| Immigrants | Grenada | 0.6 /100 | #252 | Tragic 17.9% |
| Hopi | 0.6 /100 | #253 | Tragic 17.9% |
| Hispanics or Latinos | 0.6 /100 | #254 | Tragic 17.9% |
| Immigrants | Azores | 0.6 /100 | #255 | Tragic 17.9% |
| Bahamians | 0.6 /100 | #256 | Tragic 17.9% |
| Mexican American Indians | 0.6 /100 | #257 | Tragic 17.9% |
| Immigrants | Armenia | 0.6 /100 | #258 | Tragic 17.9% |
| Ethiopians | 0.5 /100 | #259 | Tragic 17.9% |
| Immigrants | Belize | 0.5 /100 | #260 | Tragic 17.9% |
| Guamanians/Chamorros | 0.5 /100 | #261 | Tragic 17.9% |
| Sierra Leoneans | 0.4 /100 | #262 | Tragic 17.9% |
| Immigrants | Barbados | 0.4 /100 | #263 | Tragic 17.9% |
| Menominee | 0.4 /100 | #264 | Tragic 18.0% |
| Spanish Americans | 0.4 /100 | #265 | Tragic 18.0% |