Cambodian vs Sioux Cognitive Disability
COMPARE
Cambodian
Sioux
Cognitive Disability
Cognitive Disability Comparison
Cambodians
Sioux
17.3%
COGNITIVE DISABILITY
35.9/ 100
METRIC RATING
186th/ 347
METRIC RANK
17.3%
COGNITIVE DISABILITY
48.6/ 100
METRIC RATING
179th/ 347
METRIC RANK
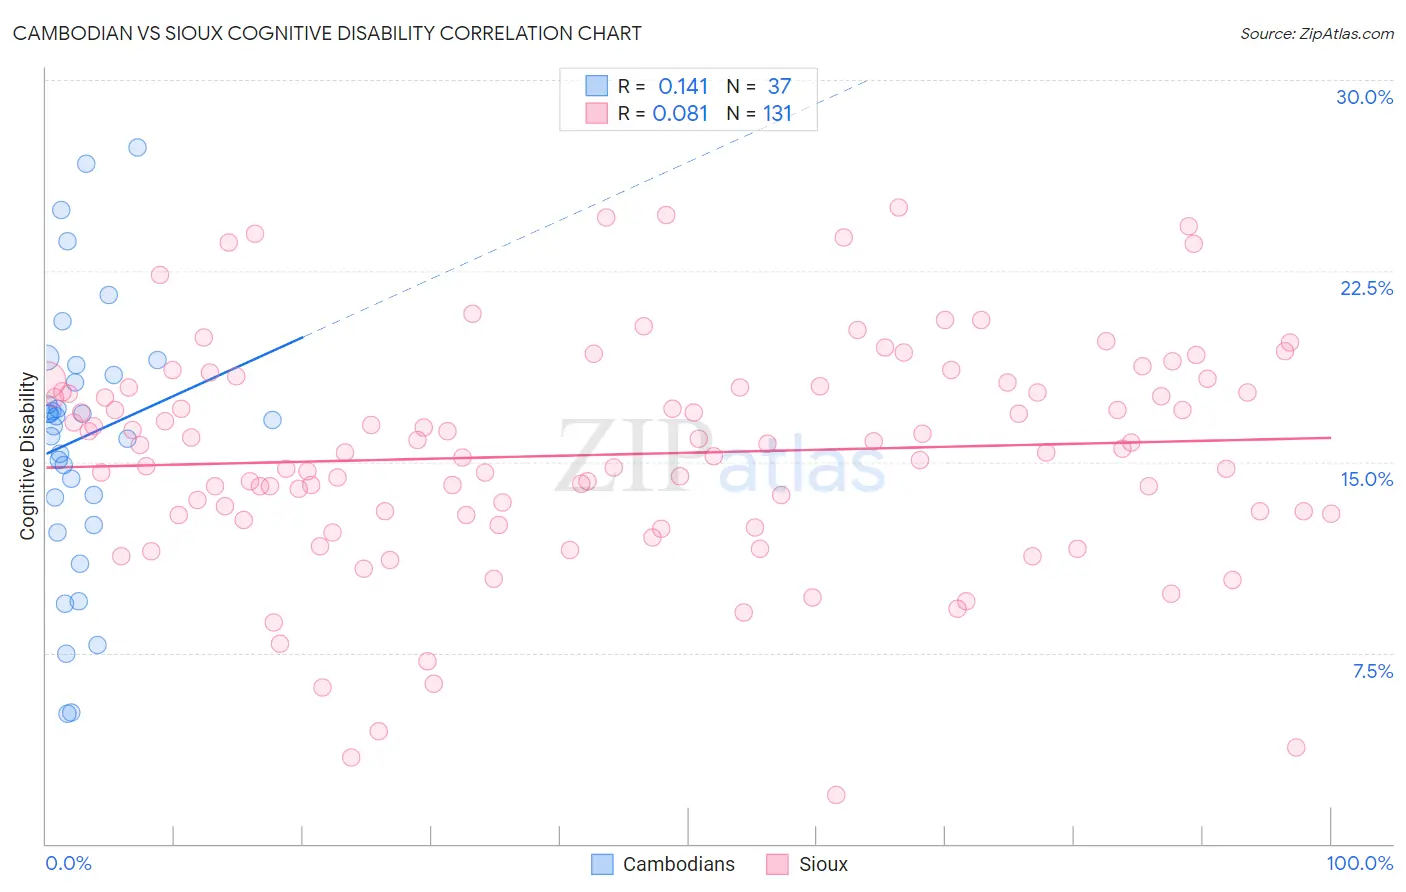
Cambodian vs Sioux Cognitive Disability Correlation Chart
The statistical analysis conducted on geographies consisting of 102,506,986 people shows a poor positive correlation between the proportion of Cambodians and percentage of population with cognitive disability in the United States with a correlation coefficient (R) of 0.141 and weighted average of 17.3%. Similarly, the statistical analysis conducted on geographies consisting of 234,153,820 people shows a slight positive correlation between the proportion of Sioux and percentage of population with cognitive disability in the United States with a correlation coefficient (R) of 0.081 and weighted average of 17.3%, a difference of 0.37%.
Cognitive Disability Correlation Summary
| Measurement | Cambodian | Sioux |
| Minimum | 5.1% | 1.9% |
| Maximum | 27.4% | 25.0% |
| Range | 22.2% | 23.1% |
| Mean | 15.9% | 15.3% |
| Median | 16.7% | 15.5% |
| Interquartile 25% (IQ1) | 13.1% | 12.9% |
| Interquartile 75% (IQ3) | 18.6% | 17.9% |
| Interquartile Range (IQR) | 5.5% | 5.0% |
| Standard Deviation (Sample) | 5.3% | 4.4% |
| Standard Deviation (Population) | 5.2% | 4.4% |
Demographics Similar to Cambodians and Sioux by Cognitive Disability
In terms of cognitive disability, the demographic groups most similar to Cambodians are Afghan (17.3%, a difference of 0.070%), Immigrants from Fiji (17.4%, a difference of 0.070%), Crow (17.3%, a difference of 0.10%), Spaniard (17.3%, a difference of 0.13%), and Immigrants from France (17.4%, a difference of 0.20%). Similarly, the demographic groups most similar to Sioux are Ute (17.3%, a difference of 0.010%), Spanish (17.3%, a difference of 0.010%), Shoshone (17.3%, a difference of 0.020%), Tsimshian (17.3%, a difference of 0.030%), and Laotian (17.3%, a difference of 0.040%).
| Demographics | Rating | Rank | Cognitive Disability |
| Immigrants | Turkey | 56.7 /100 | #172 | Average 17.2% |
| Immigrants | Northern Africa | 50.2 /100 | #173 | Average 17.3% |
| Laotians | 50.0 /100 | #174 | Average 17.3% |
| Tsimshian | 49.8 /100 | #175 | Average 17.3% |
| Shoshone | 49.2 /100 | #176 | Average 17.3% |
| Ute | 49.1 /100 | #177 | Average 17.3% |
| Spanish | 48.9 /100 | #178 | Average 17.3% |
| Sioux | 48.6 /100 | #179 | Average 17.3% |
| Pakistanis | 43.9 /100 | #180 | Average 17.3% |
| Immigrants | Guyana | 42.9 /100 | #181 | Average 17.3% |
| Arabs | 42.8 /100 | #182 | Average 17.3% |
| Spaniards | 40.3 /100 | #183 | Average 17.3% |
| Crow | 39.1 /100 | #184 | Fair 17.3% |
| Afghans | 38.2 /100 | #185 | Fair 17.3% |
| Cambodians | 35.9 /100 | #186 | Fair 17.3% |
| Immigrants | Fiji | 33.7 /100 | #187 | Fair 17.4% |
| Immigrants | France | 29.8 /100 | #188 | Fair 17.4% |
| Immigrants | Western Asia | 29.5 /100 | #189 | Fair 17.4% |
| Immigrants | Spain | 27.7 /100 | #190 | Fair 17.4% |
| Immigrants | Nonimmigrants | 27.4 /100 | #191 | Fair 17.4% |
| Immigrants | Haiti | 27.1 /100 | #192 | Fair 17.4% |