Immigrants from India vs Immigrants from Nepal Cognitive Disability
COMPARE
Immigrants from India
Immigrants from Nepal
Cognitive Disability
Cognitive Disability Comparison
Immigrants from India
Immigrants from Nepal
15.9%
COGNITIVE DISABILITY
100.0/ 100
METRIC RATING
2nd/ 347
METRIC RANK
18.0%
COGNITIVE DISABILITY
0.2/ 100
METRIC RATING
273rd/ 347
METRIC RANK
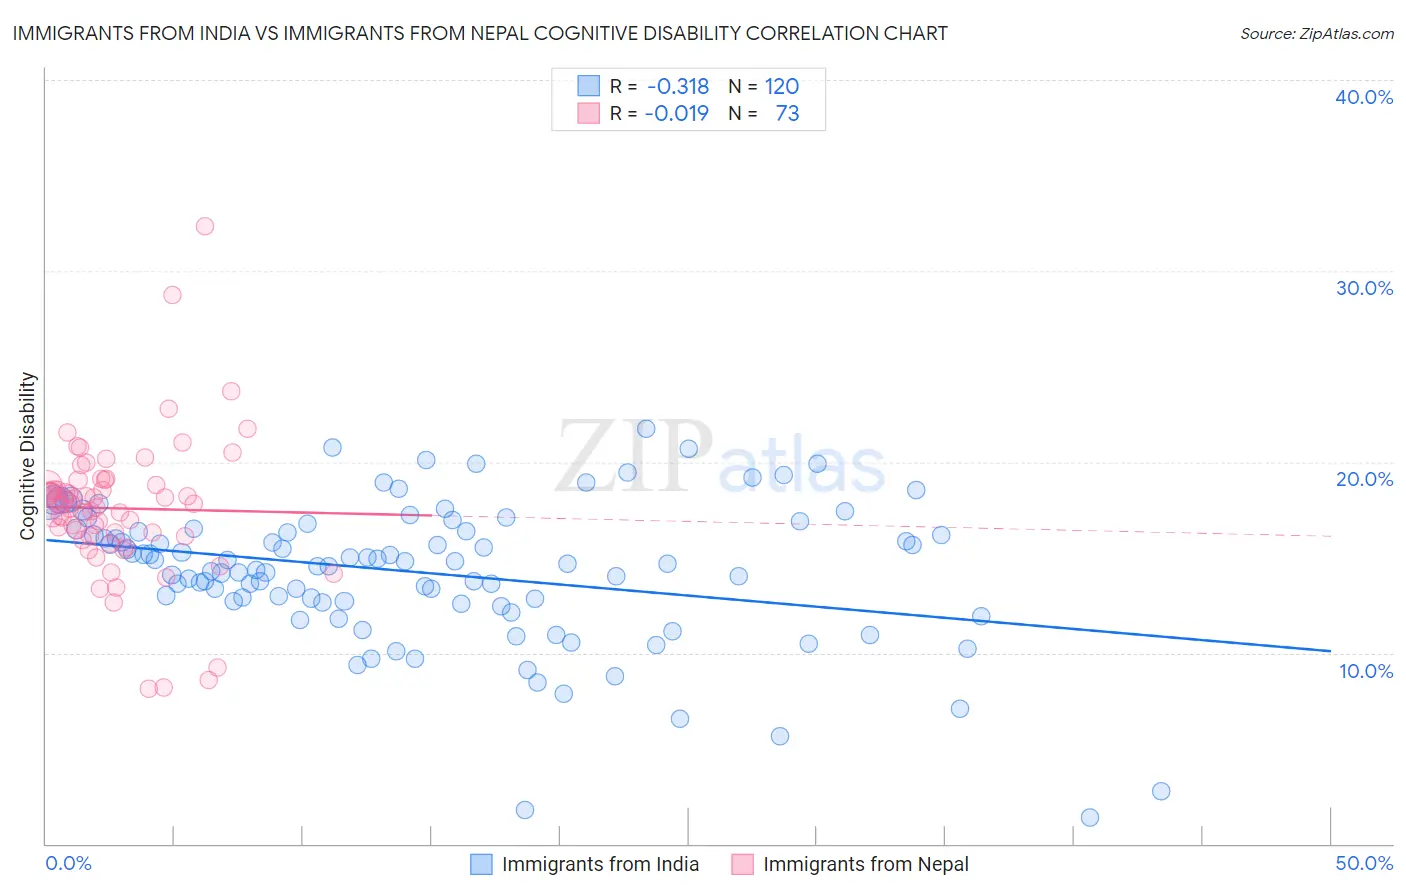
Immigrants from India vs Immigrants from Nepal Cognitive Disability Correlation Chart
The statistical analysis conducted on geographies consisting of 434,093,064 people shows a mild negative correlation between the proportion of Immigrants from India and percentage of population with cognitive disability in the United States with a correlation coefficient (R) of -0.318 and weighted average of 15.9%. Similarly, the statistical analysis conducted on geographies consisting of 186,780,805 people shows no correlation between the proportion of Immigrants from Nepal and percentage of population with cognitive disability in the United States with a correlation coefficient (R) of -0.019 and weighted average of 18.0%, a difference of 13.4%.
Cognitive Disability Correlation Summary
| Measurement | Immigrants from India | Immigrants from Nepal |
| Minimum | 1.4% | 8.1% |
| Maximum | 21.7% | 32.3% |
| Range | 20.3% | 24.2% |
| Mean | 14.2% | 17.6% |
| Median | 14.6% | 17.8% |
| Interquartile 25% (IQ1) | 12.7% | 16.1% |
| Interquartile 75% (IQ3) | 16.4% | 18.9% |
| Interquartile Range (IQR) | 3.8% | 2.8% |
| Standard Deviation (Sample) | 3.7% | 3.7% |
| Standard Deviation (Population) | 3.7% | 3.7% |
Similar Demographics by Cognitive Disability
Demographics Similar to Immigrants from India by Cognitive Disability
In terms of cognitive disability, the demographic groups most similar to Immigrants from India are Chinese (15.9%, a difference of 0.080%), Immigrants from Lithuania (16.0%, a difference of 0.27%), Immigrants from Hong Kong (16.0%, a difference of 0.68%), Immigrants from Taiwan (15.7%, a difference of 1.3%), and Thai (16.1%, a difference of 1.3%).
| Demographics | Rating | Rank | Cognitive Disability |
| Immigrants | Taiwan | 100.0 /100 | #1 | Exceptional 15.7% |
| Immigrants | India | 100.0 /100 | #2 | Exceptional 15.9% |
| Chinese | 100.0 /100 | #3 | Exceptional 15.9% |
| Immigrants | Lithuania | 100.0 /100 | #4 | Exceptional 16.0% |
| Immigrants | Hong Kong | 100.0 /100 | #5 | Exceptional 16.0% |
| Thais | 100.0 /100 | #6 | Exceptional 16.1% |
| Immigrants | Ireland | 100.0 /100 | #7 | Exceptional 16.1% |
| Immigrants | Poland | 100.0 /100 | #8 | Exceptional 16.1% |
| Assyrians/Chaldeans/Syriacs | 100.0 /100 | #9 | Exceptional 16.2% |
| Immigrants | Scotland | 100.0 /100 | #10 | Exceptional 16.2% |
| Immigrants | Czechoslovakia | 100.0 /100 | #11 | Exceptional 16.2% |
| Maltese | 100.0 /100 | #12 | Exceptional 16.2% |
| Lithuanians | 100.0 /100 | #13 | Exceptional 16.3% |
| Immigrants | Austria | 100.0 /100 | #14 | Exceptional 16.3% |
| Immigrants | Greece | 100.0 /100 | #15 | Exceptional 16.3% |
Demographics Similar to Immigrants from Nepal by Cognitive Disability
In terms of cognitive disability, the demographic groups most similar to Immigrants from Nepal are Immigrants from Nigeria (18.0%, a difference of 0.010%), Immigrants from Laos (18.1%, a difference of 0.11%), Immigrants from Honduras (18.0%, a difference of 0.12%), Potawatomi (18.0%, a difference of 0.13%), and Yuman (18.1%, a difference of 0.15%).
| Demographics | Rating | Rank | Cognitive Disability |
| Belizeans | 0.4 /100 | #266 | Tragic 18.0% |
| Nepalese | 0.3 /100 | #267 | Tragic 18.0% |
| Cherokee | 0.3 /100 | #268 | Tragic 18.0% |
| Hondurans | 0.3 /100 | #269 | Tragic 18.0% |
| Immigrants | Bahamas | 0.3 /100 | #270 | Tragic 18.0% |
| Potawatomi | 0.2 /100 | #271 | Tragic 18.0% |
| Immigrants | Honduras | 0.2 /100 | #272 | Tragic 18.0% |
| Immigrants | Nepal | 0.2 /100 | #273 | Tragic 18.0% |
| Immigrants | Nigeria | 0.2 /100 | #274 | Tragic 18.0% |
| Immigrants | Laos | 0.2 /100 | #275 | Tragic 18.1% |
| Yuman | 0.2 /100 | #276 | Tragic 18.1% |
| Immigrants | Kuwait | 0.2 /100 | #277 | Tragic 18.1% |
| Immigrants | Micronesia | 0.2 /100 | #278 | Tragic 18.1% |
| Chippewa | 0.1 /100 | #279 | Tragic 18.1% |
| West Indians | 0.1 /100 | #280 | Tragic 18.1% |