Somali vs Liberian Cognitive Disability
COMPARE
Somali
Liberian
Cognitive Disability
Cognitive Disability Comparison
Somalis
Liberians
19.8%
COGNITIVE DISABILITY
0.0/ 100
METRIC RATING
345th/ 347
METRIC RANK
18.6%
COGNITIVE DISABILITY
0.0/ 100
METRIC RATING
317th/ 347
METRIC RANK
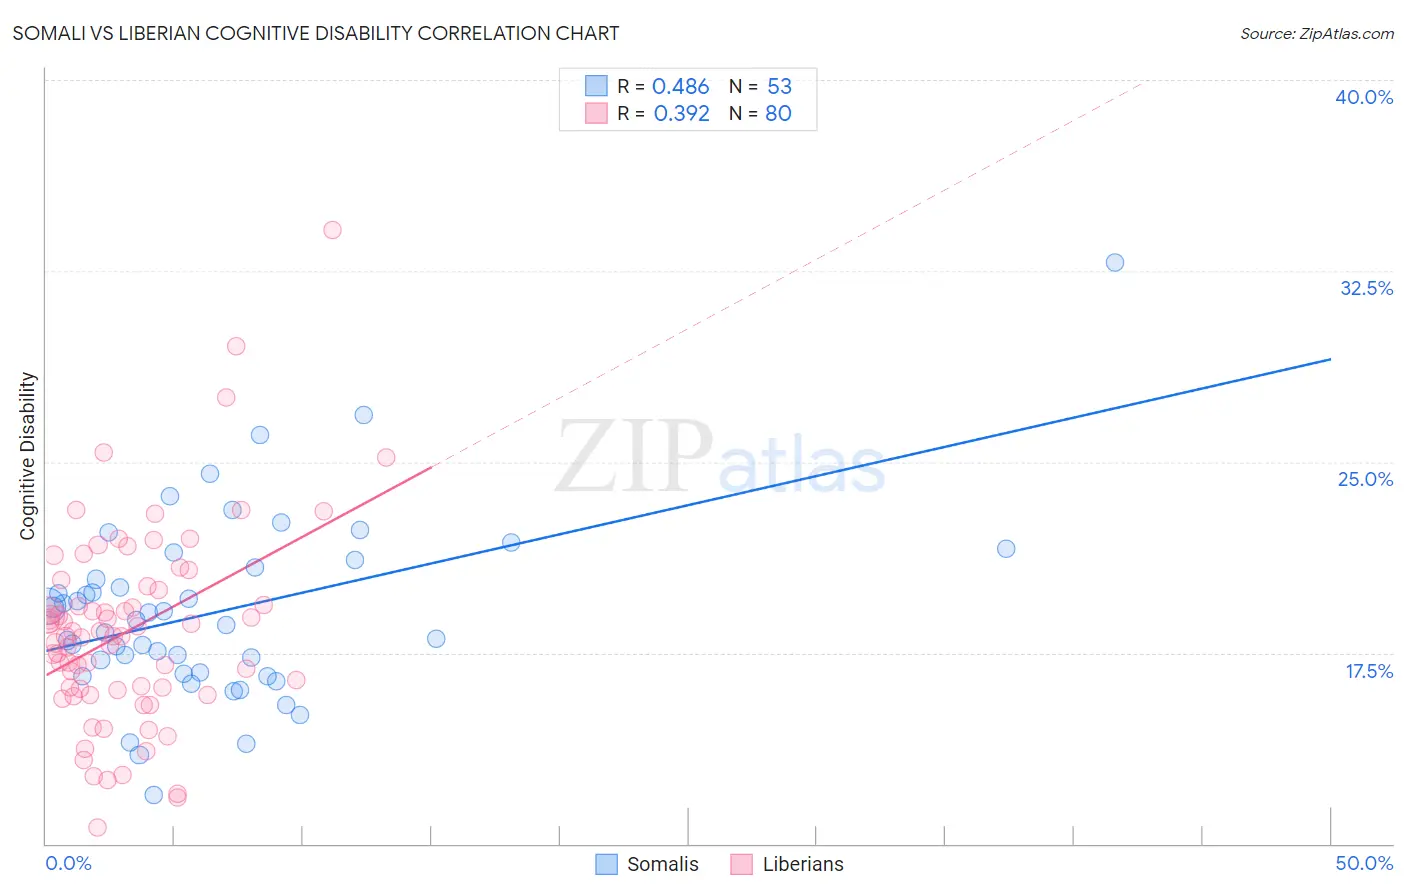
Somali vs Liberian Cognitive Disability Correlation Chart
The statistical analysis conducted on geographies consisting of 99,318,466 people shows a moderate positive correlation between the proportion of Somalis and percentage of population with cognitive disability in the United States with a correlation coefficient (R) of 0.486 and weighted average of 19.8%. Similarly, the statistical analysis conducted on geographies consisting of 118,084,793 people shows a mild positive correlation between the proportion of Liberians and percentage of population with cognitive disability in the United States with a correlation coefficient (R) of 0.392 and weighted average of 18.6%, a difference of 6.6%.
Cognitive Disability Correlation Summary
| Measurement | Somali | Liberian |
| Minimum | 11.9% | 10.6% |
| Maximum | 32.8% | 34.1% |
| Range | 20.9% | 23.5% |
| Mean | 19.1% | 18.4% |
| Median | 18.8% | 18.1% |
| Interquartile 25% (IQ1) | 16.7% | 16.1% |
| Interquartile 75% (IQ3) | 21.0% | 20.1% |
| Interquartile Range (IQR) | 4.3% | 4.0% |
| Standard Deviation (Sample) | 3.6% | 3.9% |
| Standard Deviation (Population) | 3.6% | 3.9% |
Similar Demographics by Cognitive Disability
Demographics Similar to Somalis by Cognitive Disability
In terms of cognitive disability, the demographic groups most similar to Somalis are Immigrants from Cabo Verde (19.9%, a difference of 0.16%), Immigrants from Congo (19.7%, a difference of 0.56%), Immigrants from Somalia (20.0%, a difference of 0.89%), Immigrants from Zaire (19.4%, a difference of 2.2%), and Tohono O'odham (19.3%, a difference of 2.9%).
| Demographics | Rating | Rank | Cognitive Disability |
| Immigrants | Yemen | 0.0 /100 | #333 | Tragic 18.8% |
| Sudanese | 0.0 /100 | #334 | Tragic 18.9% |
| Senegalese | 0.0 /100 | #335 | Tragic 19.0% |
| Blacks/African Americans | 0.0 /100 | #336 | Tragic 19.0% |
| Immigrants | Saudi Arabia | 0.0 /100 | #337 | Tragic 19.1% |
| Lumbee | 0.0 /100 | #338 | Tragic 19.1% |
| Puerto Ricans | 0.0 /100 | #339 | Tragic 19.2% |
| Cape Verdeans | 0.0 /100 | #340 | Tragic 19.2% |
| Tohono O'odham | 0.0 /100 | #341 | Tragic 19.3% |
| Houma | 0.0 /100 | #342 | Tragic 19.3% |
| Immigrants | Zaire | 0.0 /100 | #343 | Tragic 19.4% |
| Immigrants | Congo | 0.0 /100 | #344 | Tragic 19.7% |
| Somalis | 0.0 /100 | #345 | Tragic 19.8% |
| Immigrants | Cabo Verde | 0.0 /100 | #346 | Tragic 19.9% |
| Immigrants | Somalia | 0.0 /100 | #347 | Tragic 20.0% |
Demographics Similar to Liberians by Cognitive Disability
In terms of cognitive disability, the demographic groups most similar to Liberians are Immigrants from Middle Africa (18.6%, a difference of 0.080%), Bangladeshi (18.6%, a difference of 0.12%), Immigrants from Dominica (18.6%, a difference of 0.16%), Comanche (18.6%, a difference of 0.16%), and Apache (18.6%, a difference of 0.20%).
| Demographics | Rating | Rank | Cognitive Disability |
| Choctaw | 0.0 /100 | #310 | Tragic 18.4% |
| Hmong | 0.0 /100 | #311 | Tragic 18.4% |
| Chickasaw | 0.0 /100 | #312 | Tragic 18.5% |
| Yaqui | 0.0 /100 | #313 | Tragic 18.5% |
| Sub-Saharan Africans | 0.0 /100 | #314 | Tragic 18.5% |
| Immigrants | Dominica | 0.0 /100 | #315 | Tragic 18.6% |
| Immigrants | Middle Africa | 0.0 /100 | #316 | Tragic 18.6% |
| Liberians | 0.0 /100 | #317 | Tragic 18.6% |
| Bangladeshis | 0.0 /100 | #318 | Tragic 18.6% |
| Comanche | 0.0 /100 | #319 | Tragic 18.6% |
| Apache | 0.0 /100 | #320 | Tragic 18.6% |
| Africans | 0.0 /100 | #321 | Tragic 18.6% |
| Immigrants | Liberia | 0.0 /100 | #322 | Tragic 18.7% |
| Pueblo | 0.0 /100 | #323 | Tragic 18.7% |
| Dominicans | 0.0 /100 | #324 | Tragic 18.7% |