Somali vs Iraqi Disability
COMPARE
Somali
Iraqi
Disability
Disability Comparison
Somalis
Iraqis
11.9%
DISABILITY
17.3/ 100
METRIC RATING
194th/ 347
METRIC RANK
11.8%
DISABILITY
30.0/ 100
METRIC RATING
184th/ 347
METRIC RANK
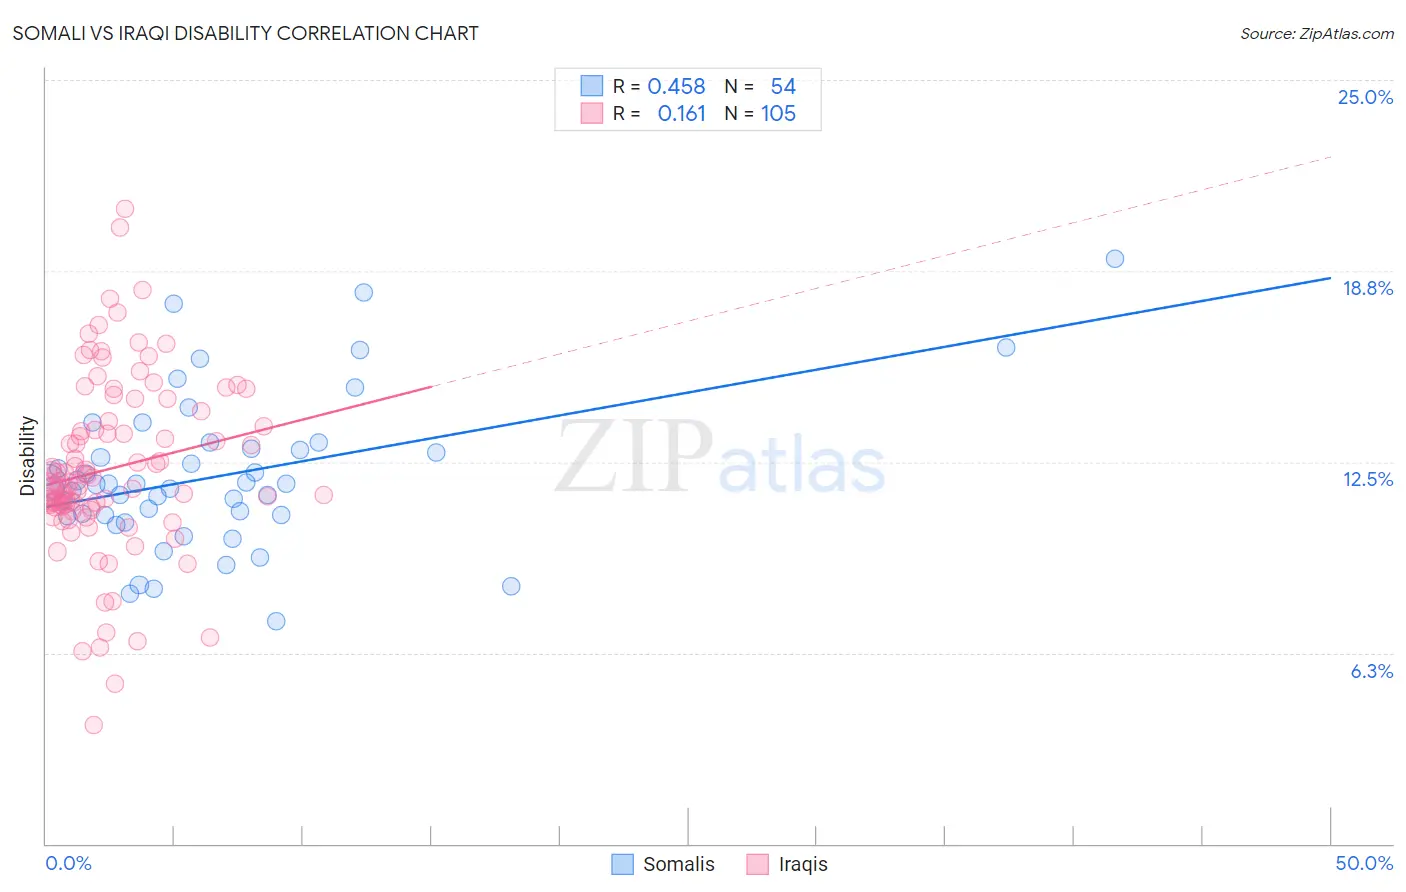
Somali vs Iraqi Disability Correlation Chart
The statistical analysis conducted on geographies consisting of 99,315,749 people shows a moderate positive correlation between the proportion of Somalis and percentage of population with a disability in the United States with a correlation coefficient (R) of 0.458 and weighted average of 11.9%. Similarly, the statistical analysis conducted on geographies consisting of 170,650,959 people shows a poor positive correlation between the proportion of Iraqis and percentage of population with a disability in the United States with a correlation coefficient (R) of 0.161 and weighted average of 11.8%, a difference of 0.79%.
Disability Correlation Summary
| Measurement | Somali | Iraqi |
| Minimum | 7.3% | 3.9% |
| Maximum | 19.1% | 20.8% |
| Range | 11.8% | 16.9% |
| Mean | 12.0% | 12.3% |
| Median | 11.8% | 11.8% |
| Interquartile 25% (IQ1) | 10.8% | 11.0% |
| Interquartile 75% (IQ3) | 12.9% | 14.0% |
| Interquartile Range (IQR) | 2.2% | 3.0% |
| Standard Deviation (Sample) | 2.5% | 2.9% |
| Standard Deviation (Population) | 2.5% | 2.9% |
Demographics Similar to Somalis and Iraqis by Disability
In terms of disability, the demographic groups most similar to Somalis are Immigrants from Bosnia and Herzegovina (11.9%, a difference of 0.050%), Lithuanian (11.9%, a difference of 0.11%), Barbadian (11.9%, a difference of 0.11%), Serbian (11.9%, a difference of 0.15%), and Ute (11.9%, a difference of 0.16%). Similarly, the demographic groups most similar to Iraqis are Honduran (11.8%, a difference of 0.060%), Immigrants from Burma/Myanmar (11.8%, a difference of 0.080%), Immigrants from Scotland (11.8%, a difference of 0.090%), Lebanese (11.8%, a difference of 0.11%), and Icelander (11.8%, a difference of 0.20%).
| Demographics | Rating | Rank | Disability |
| Immigrants | Armenia | 41.9 /100 | #179 | Average 11.7% |
| Immigrants | Honduras | 37.8 /100 | #180 | Fair 11.8% |
| Immigrants | Oceania | 34.3 /100 | #181 | Fair 11.8% |
| Icelanders | 34.0 /100 | #182 | Fair 11.8% |
| Hondurans | 31.2 /100 | #183 | Fair 11.8% |
| Iraqis | 30.0 /100 | #184 | Fair 11.8% |
| Immigrants | Burma/Myanmar | 28.5 /100 | #185 | Fair 11.8% |
| Immigrants | Scotland | 28.2 /100 | #186 | Fair 11.8% |
| Lebanese | 27.9 /100 | #187 | Fair 11.8% |
| Immigrants | Mexico | 23.8 /100 | #188 | Fair 11.9% |
| Immigrants | Zaire | 21.8 /100 | #189 | Fair 11.9% |
| Immigrants | West Indies | 21.1 /100 | #190 | Fair 11.9% |
| Ute | 19.5 /100 | #191 | Poor 11.9% |
| Lithuanians | 18.8 /100 | #192 | Poor 11.9% |
| Immigrants | Bosnia and Herzegovina | 18.0 /100 | #193 | Poor 11.9% |
| Somalis | 17.3 /100 | #194 | Poor 11.9% |
| Barbadians | 15.8 /100 | #195 | Poor 11.9% |
| Serbians | 15.4 /100 | #196 | Poor 11.9% |
| Immigrants | Belize | 15.2 /100 | #197 | Poor 11.9% |
| Ukrainians | 14.7 /100 | #198 | Poor 11.9% |
| Immigrants | Panama | 14.6 /100 | #199 | Poor 11.9% |