Somali vs Fijian Disability
COMPARE
Somali
Fijian
Disability
Disability Comparison
Somalis
Fijians
11.9%
DISABILITY
17.3/ 100
METRIC RATING
194th/ 347
METRIC RANK
12.8%
DISABILITY
0.0/ 100
METRIC RATING
279th/ 347
METRIC RANK
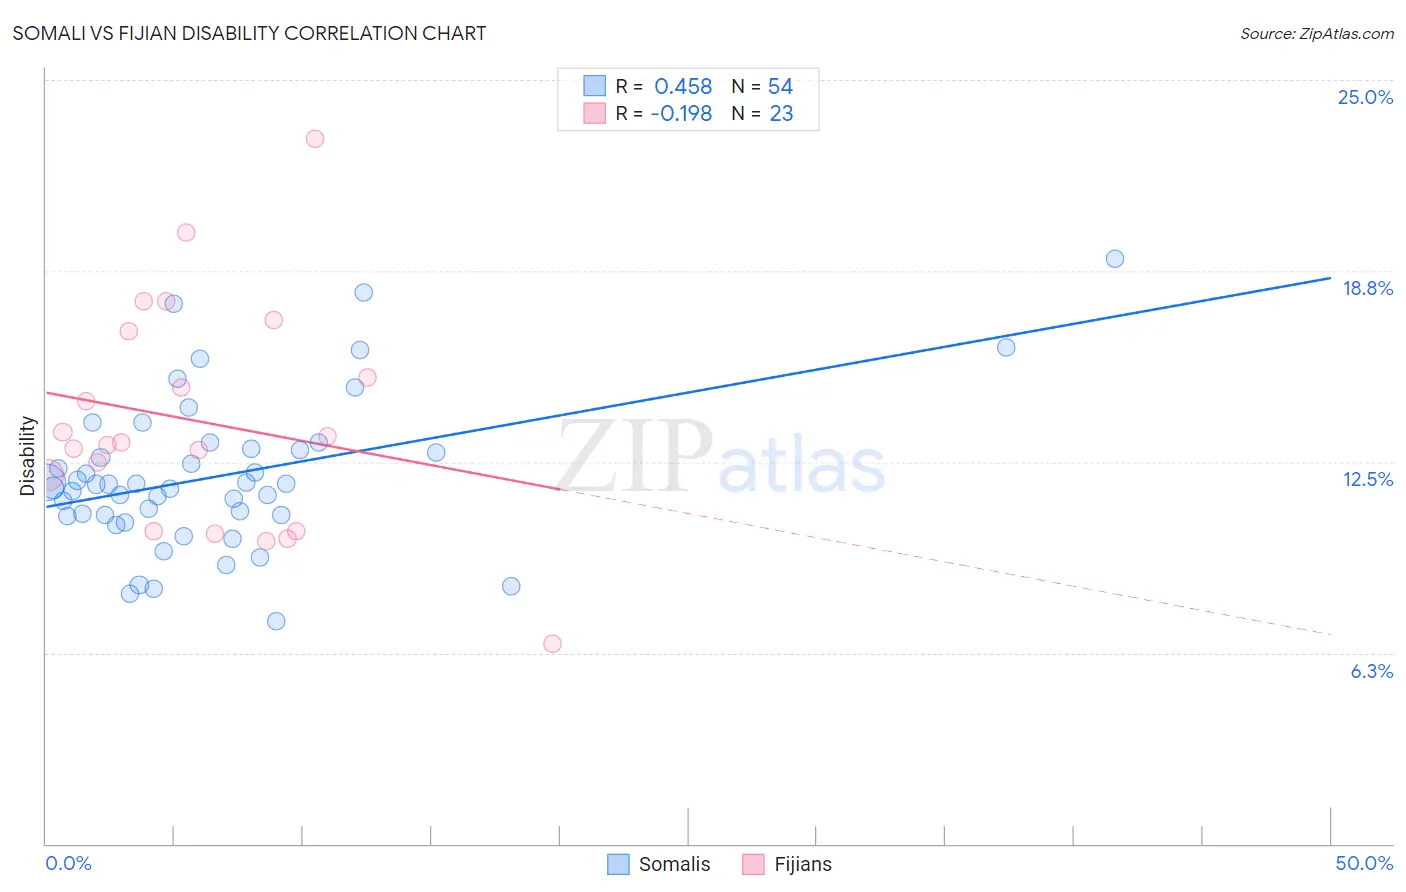
Somali vs Fijian Disability Correlation Chart
The statistical analysis conducted on geographies consisting of 99,315,749 people shows a moderate positive correlation between the proportion of Somalis and percentage of population with a disability in the United States with a correlation coefficient (R) of 0.458 and weighted average of 11.9%. Similarly, the statistical analysis conducted on geographies consisting of 55,947,896 people shows a poor negative correlation between the proportion of Fijians and percentage of population with a disability in the United States with a correlation coefficient (R) of -0.198 and weighted average of 12.8%, a difference of 7.9%.
Disability Correlation Summary
| Measurement | Somali | Fijian |
| Minimum | 7.3% | 6.6% |
| Maximum | 19.1% | 23.1% |
| Range | 11.8% | 16.5% |
| Mean | 12.0% | 13.8% |
| Median | 11.8% | 13.1% |
| Interquartile 25% (IQ1) | 10.8% | 10.2% |
| Interquartile 75% (IQ3) | 12.9% | 16.8% |
| Interquartile Range (IQR) | 2.2% | 6.5% |
| Standard Deviation (Sample) | 2.5% | 3.7% |
| Standard Deviation (Population) | 2.5% | 3.7% |
Similar Demographics by Disability
Demographics Similar to Somalis by Disability
In terms of disability, the demographic groups most similar to Somalis are Immigrants from Bosnia and Herzegovina (11.9%, a difference of 0.050%), Lithuanian (11.9%, a difference of 0.11%), Barbadian (11.9%, a difference of 0.11%), Serbian (11.9%, a difference of 0.15%), and Ute (11.9%, a difference of 0.16%).
| Demographics | Rating | Rank | Disability |
| Lebanese | 27.9 /100 | #187 | Fair 11.8% |
| Immigrants | Mexico | 23.8 /100 | #188 | Fair 11.9% |
| Immigrants | Zaire | 21.8 /100 | #189 | Fair 11.9% |
| Immigrants | West Indies | 21.1 /100 | #190 | Fair 11.9% |
| Ute | 19.5 /100 | #191 | Poor 11.9% |
| Lithuanians | 18.8 /100 | #192 | Poor 11.9% |
| Immigrants | Bosnia and Herzegovina | 18.0 /100 | #193 | Poor 11.9% |
| Somalis | 17.3 /100 | #194 | Poor 11.9% |
| Barbadians | 15.8 /100 | #195 | Poor 11.9% |
| Serbians | 15.4 /100 | #196 | Poor 11.9% |
| Immigrants | Belize | 15.2 /100 | #197 | Poor 11.9% |
| Ukrainians | 14.7 /100 | #198 | Poor 11.9% |
| Immigrants | Panama | 14.6 /100 | #199 | Poor 11.9% |
| Belizeans | 12.8 /100 | #200 | Poor 11.9% |
| Assyrians/Chaldeans/Syriacs | 12.6 /100 | #201 | Poor 11.9% |
Demographics Similar to Fijians by Disability
In terms of disability, the demographic groups most similar to Fijians are Spanish (12.8%, a difference of 0.050%), German (12.8%, a difference of 0.090%), Immigrants from Portugal (12.9%, a difference of 0.19%), Dutch (12.8%, a difference of 0.26%), and Hmong (12.8%, a difference of 0.31%).
| Demographics | Rating | Rank | Disability |
| Dominicans | 0.0 /100 | #272 | Tragic 12.7% |
| Finns | 0.0 /100 | #273 | Tragic 12.7% |
| Nepalese | 0.0 /100 | #274 | Tragic 12.8% |
| Sioux | 0.0 /100 | #275 | Tragic 12.8% |
| Hmong | 0.0 /100 | #276 | Tragic 12.8% |
| Dutch | 0.0 /100 | #277 | Tragic 12.8% |
| Germans | 0.0 /100 | #278 | Tragic 12.8% |
| Fijians | 0.0 /100 | #279 | Tragic 12.8% |
| Spanish | 0.0 /100 | #280 | Tragic 12.8% |
| Immigrants | Portugal | 0.0 /100 | #281 | Tragic 12.9% |
| Scottish | 0.0 /100 | #282 | Tragic 12.9% |
| Irish | 0.0 /100 | #283 | Tragic 12.9% |
| Welsh | 0.0 /100 | #284 | Tragic 12.9% |
| Crow | 0.0 /100 | #285 | Tragic 12.9% |
| English | 0.0 /100 | #286 | Tragic 13.0% |