Immigrants from South Africa vs Immigrants from Lithuania Disability Age 5 to 17
COMPARE
Immigrants from South Africa
Immigrants from Lithuania
Disability Age 5 to 17
Disability Age 5 to 17 Comparison
Immigrants from South Africa
Immigrants from Lithuania
5.3%
DISABILITY AGE 5 TO 17
98.1/ 100
METRIC RATING
108th/ 347
METRIC RANK
5.1%
DISABILITY AGE 5 TO 17
99.9/ 100
METRIC RATING
53rd/ 347
METRIC RANK
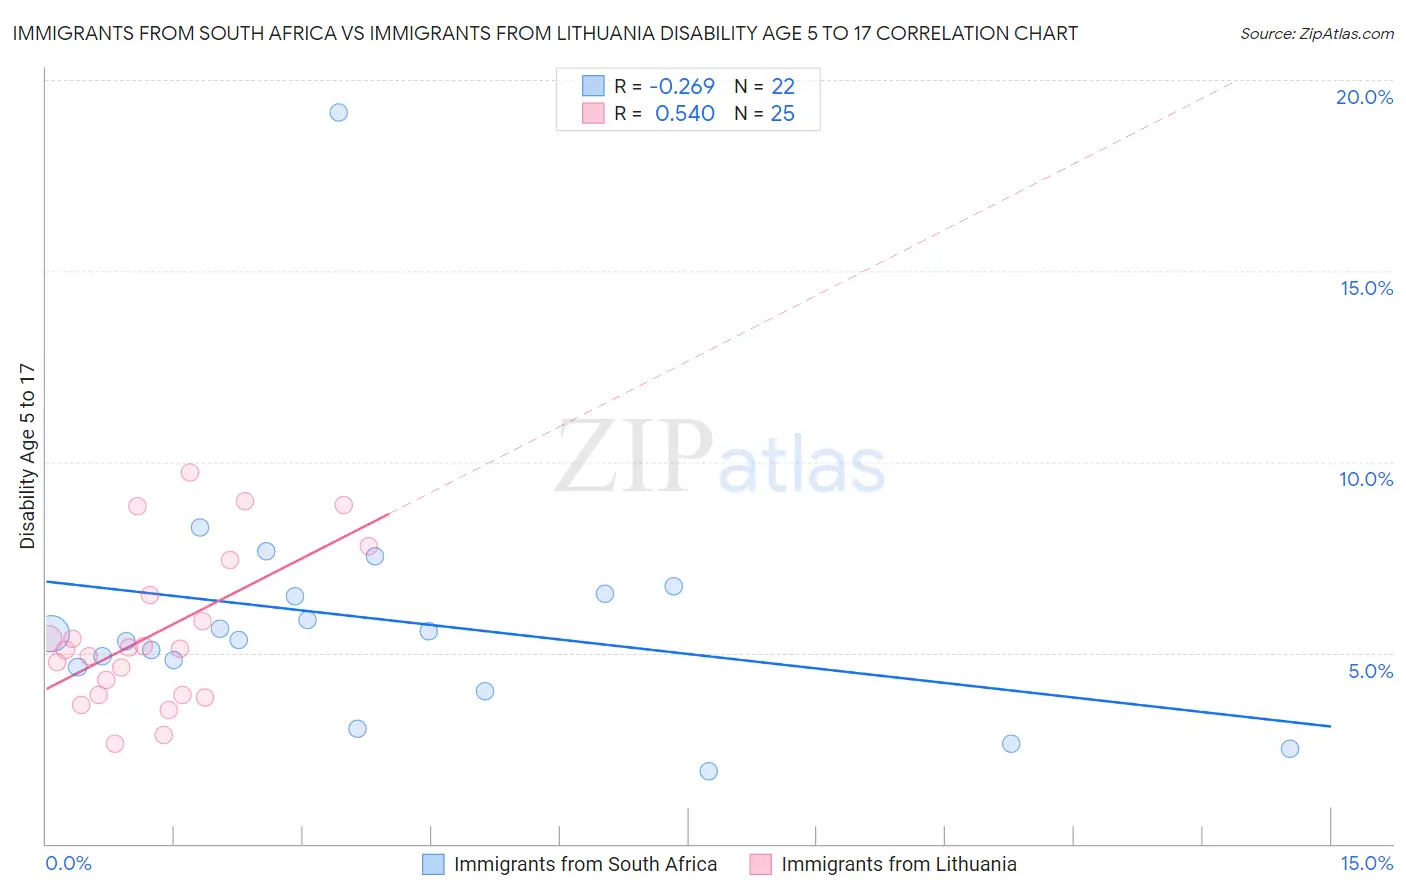
Immigrants from South Africa vs Immigrants from Lithuania Disability Age 5 to 17 Correlation Chart
The statistical analysis conducted on geographies consisting of 231,812,836 people shows a weak negative correlation between the proportion of Immigrants from South Africa and percentage of population with a disability between the ages 5 and 17 in the United States with a correlation coefficient (R) of -0.269 and weighted average of 5.3%. Similarly, the statistical analysis conducted on geographies consisting of 117,321,416 people shows a substantial positive correlation between the proportion of Immigrants from Lithuania and percentage of population with a disability between the ages 5 and 17 in the United States with a correlation coefficient (R) of 0.540 and weighted average of 5.1%, a difference of 4.3%.
Disability Age 5 to 17 Correlation Summary
| Measurement | Immigrants from South Africa | Immigrants from Lithuania |
| Minimum | 1.9% | 2.6% |
| Maximum | 19.1% | 9.7% |
| Range | 17.3% | 7.1% |
| Mean | 5.9% | 5.5% |
| Median | 5.4% | 5.1% |
| Interquartile 25% (IQ1) | 4.6% | 3.9% |
| Interquartile 75% (IQ3) | 6.5% | 7.0% |
| Interquartile Range (IQR) | 1.9% | 3.1% |
| Standard Deviation (Sample) | 3.4% | 2.0% |
| Standard Deviation (Population) | 3.3% | 2.0% |
Similar Demographics by Disability Age 5 to 17
Demographics Similar to Immigrants from South Africa by Disability Age 5 to 17
In terms of disability age 5 to 17, the demographic groups most similar to Immigrants from South Africa are Russian (5.3%, a difference of 0.040%), Immigrants from Northern Africa (5.3%, a difference of 0.040%), Immigrants from Yemen (5.3%, a difference of 0.070%), Immigrants from Eritrea (5.3%, a difference of 0.080%), and Ethiopian (5.3%, a difference of 0.12%).
| Demographics | Rating | Rank | Disability Age 5 to 17 |
| Menominee | 98.7 /100 | #101 | Exceptional 5.3% |
| Nicaraguans | 98.6 /100 | #102 | Exceptional 5.3% |
| Salvadorans | 98.6 /100 | #103 | Exceptional 5.3% |
| Peruvians | 98.5 /100 | #104 | Exceptional 5.3% |
| Immigrants | Italy | 98.4 /100 | #105 | Exceptional 5.3% |
| Immigrants | Yemen | 98.2 /100 | #106 | Exceptional 5.3% |
| Russians | 98.2 /100 | #107 | Exceptional 5.3% |
| Immigrants | South Africa | 98.1 /100 | #108 | Exceptional 5.3% |
| Immigrants | Northern Africa | 98.1 /100 | #109 | Exceptional 5.3% |
| Immigrants | Eritrea | 98.0 /100 | #110 | Exceptional 5.3% |
| Ethiopians | 97.9 /100 | #111 | Exceptional 5.3% |
| Immigrants | Latvia | 97.9 /100 | #112 | Exceptional 5.3% |
| Aleuts | 97.8 /100 | #113 | Exceptional 5.3% |
| Immigrants | Northern Europe | 97.8 /100 | #114 | Exceptional 5.3% |
| Cubans | 97.8 /100 | #115 | Exceptional 5.3% |
Demographics Similar to Immigrants from Lithuania by Disability Age 5 to 17
In terms of disability age 5 to 17, the demographic groups most similar to Immigrants from Lithuania are Paraguayan (5.1%, a difference of 0.030%), Immigrants from Fiji (5.1%, a difference of 0.050%), Laotian (5.1%, a difference of 0.070%), Immigrants from Turkey (5.1%, a difference of 0.090%), and Turkish (5.1%, a difference of 0.14%).
| Demographics | Rating | Rank | Disability Age 5 to 17 |
| Assyrians/Chaldeans/Syriacs | 100.0 /100 | #46 | Exceptional 5.0% |
| Vietnamese | 100.0 /100 | #47 | Exceptional 5.1% |
| Koreans | 100.0 /100 | #48 | Exceptional 5.1% |
| Immigrants | Western Asia | 100.0 /100 | #49 | Exceptional 5.1% |
| Argentineans | 99.9 /100 | #50 | Exceptional 5.1% |
| Turks | 99.9 /100 | #51 | Exceptional 5.1% |
| Immigrants | Fiji | 99.9 /100 | #52 | Exceptional 5.1% |
| Immigrants | Lithuania | 99.9 /100 | #53 | Exceptional 5.1% |
| Paraguayans | 99.9 /100 | #54 | Exceptional 5.1% |
| Laotians | 99.9 /100 | #55 | Exceptional 5.1% |
| Immigrants | Turkey | 99.9 /100 | #56 | Exceptional 5.1% |
| Immigrants | Poland | 99.9 /100 | #57 | Exceptional 5.1% |
| Immigrants | Ukraine | 99.9 /100 | #58 | Exceptional 5.1% |
| Immigrants | North Macedonia | 99.9 /100 | #59 | Exceptional 5.1% |
| Immigrants | Eastern Europe | 99.9 /100 | #60 | Exceptional 5.1% |