Slovak vs Serbian Disability Age 5 to 17
COMPARE
Slovak
Serbian
Disability Age 5 to 17
Disability Age 5 to 17 Comparison
Slovaks
Serbians
6.5%
DISABILITY AGE 5 TO 17
0.0/ 100
METRIC RATING
322nd/ 347
METRIC RANK
5.6%
DISABILITY AGE 5 TO 17
54.0/ 100
METRIC RATING
170th/ 347
METRIC RANK
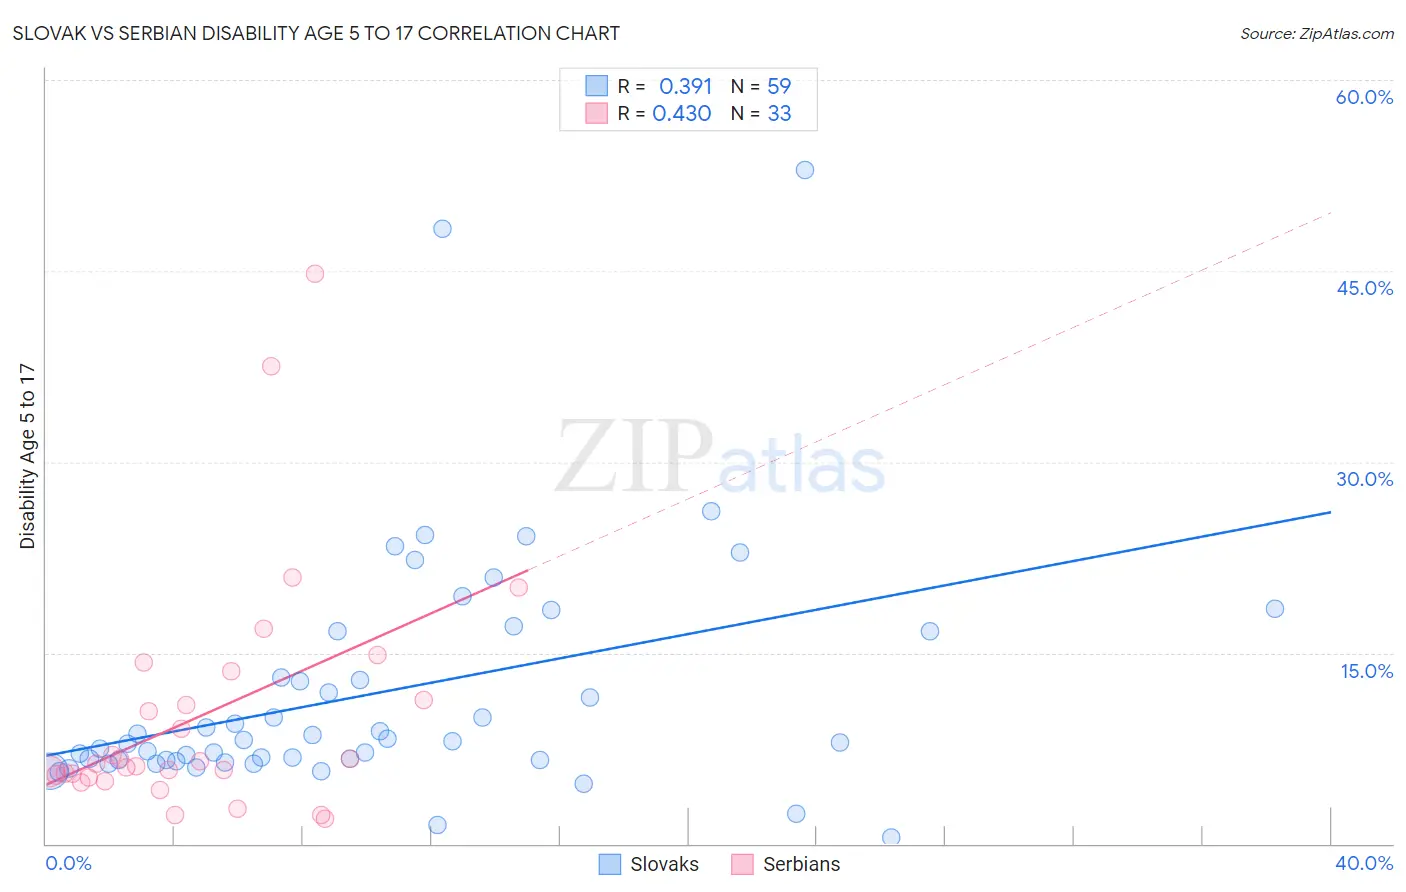
Slovak vs Serbian Disability Age 5 to 17 Correlation Chart
The statistical analysis conducted on geographies consisting of 393,379,089 people shows a mild positive correlation between the proportion of Slovaks and percentage of population with a disability between the ages 5 and 17 in the United States with a correlation coefficient (R) of 0.391 and weighted average of 6.5%. Similarly, the statistical analysis conducted on geographies consisting of 265,742,424 people shows a moderate positive correlation between the proportion of Serbians and percentage of population with a disability between the ages 5 and 17 in the United States with a correlation coefficient (R) of 0.430 and weighted average of 5.6%, a difference of 16.6%.
Disability Age 5 to 17 Correlation Summary
| Measurement | Slovak | Serbian |
| Minimum | 0.44% | 2.0% |
| Maximum | 52.9% | 44.7% |
| Range | 52.5% | 42.7% |
| Mean | 11.8% | 10.0% |
| Median | 8.1% | 6.2% |
| Interquartile 25% (IQ1) | 6.5% | 5.3% |
| Interquartile 75% (IQ3) | 16.7% | 12.4% |
| Interquartile Range (IQR) | 10.1% | 7.1% |
| Standard Deviation (Sample) | 9.6% | 9.4% |
| Standard Deviation (Population) | 9.5% | 9.3% |
Similar Demographics by Disability Age 5 to 17
Demographics Similar to Slovaks by Disability Age 5 to 17
In terms of disability age 5 to 17, the demographic groups most similar to Slovaks are Tohono O'odham (6.5%, a difference of 0.020%), Osage (6.5%, a difference of 0.040%), Dominican (6.5%, a difference of 0.12%), American (6.5%, a difference of 0.17%), and Potawatomi (6.5%, a difference of 0.31%).
| Demographics | Rating | Rank | Disability Age 5 to 17 |
| Immigrants | Portugal | 0.0 /100 | #315 | Tragic 6.4% |
| Immigrants | Dominican Republic | 0.0 /100 | #316 | Tragic 6.4% |
| Kiowa | 0.0 /100 | #317 | Tragic 6.4% |
| Comanche | 0.0 /100 | #318 | Tragic 6.4% |
| Delaware | 0.0 /100 | #319 | Tragic 6.5% |
| Africans | 0.0 /100 | #320 | Tragic 6.5% |
| Tohono O'odham | 0.0 /100 | #321 | Tragic 6.5% |
| Slovaks | 0.0 /100 | #322 | Tragic 6.5% |
| Osage | 0.0 /100 | #323 | Tragic 6.5% |
| Dominicans | 0.0 /100 | #324 | Tragic 6.5% |
| Americans | 0.0 /100 | #325 | Tragic 6.5% |
| Potawatomi | 0.0 /100 | #326 | Tragic 6.5% |
| French American Indians | 0.0 /100 | #327 | Tragic 6.6% |
| Pennsylvania Germans | 0.0 /100 | #328 | Tragic 6.6% |
| Blackfeet | 0.0 /100 | #329 | Tragic 6.6% |
Demographics Similar to Serbians by Disability Age 5 to 17
In terms of disability age 5 to 17, the demographic groups most similar to Serbians are Immigrants from Iraq (5.6%, a difference of 0.0%), Immigrants from Norway (5.6%, a difference of 0.080%), Iraqi (5.6%, a difference of 0.10%), Ukrainian (5.6%, a difference of 0.12%), and Uruguayan (5.6%, a difference of 0.15%).
| Demographics | Rating | Rank | Disability Age 5 to 17 |
| Immigrants | Southern Europe | 64.0 /100 | #163 | Good 5.6% |
| Immigrants | Scotland | 61.9 /100 | #164 | Good 5.6% |
| Lebanese | 61.4 /100 | #165 | Good 5.6% |
| Greeks | 60.6 /100 | #166 | Good 5.6% |
| Immigrants | Burma/Myanmar | 59.3 /100 | #167 | Average 5.6% |
| Iraqis | 56.0 /100 | #168 | Average 5.6% |
| Immigrants | Norway | 55.7 /100 | #169 | Average 5.6% |
| Serbians | 54.0 /100 | #170 | Average 5.6% |
| Immigrants | Iraq | 53.9 /100 | #171 | Average 5.6% |
| Ukrainians | 51.5 /100 | #172 | Average 5.6% |
| Uruguayans | 51.0 /100 | #173 | Average 5.6% |
| Costa Ricans | 50.0 /100 | #174 | Average 5.6% |
| Shoshone | 49.4 /100 | #175 | Average 5.6% |
| Immigrants | Central America | 49.4 /100 | #176 | Average 5.6% |
| Immigrants | Western Europe | 47.8 /100 | #177 | Average 5.6% |