Slovak vs Nepalese Median Male Earnings
COMPARE
Slovak
Nepalese
Median Male Earnings
Median Male Earnings Comparison
Slovaks
Nepalese
$56,306
MEDIAN MALE EARNINGS
85.5/ 100
METRIC RATING
138th/ 347
METRIC RANK
$49,458
MEDIAN MALE EARNINGS
0.7/ 100
METRIC RATING
259th/ 347
METRIC RANK
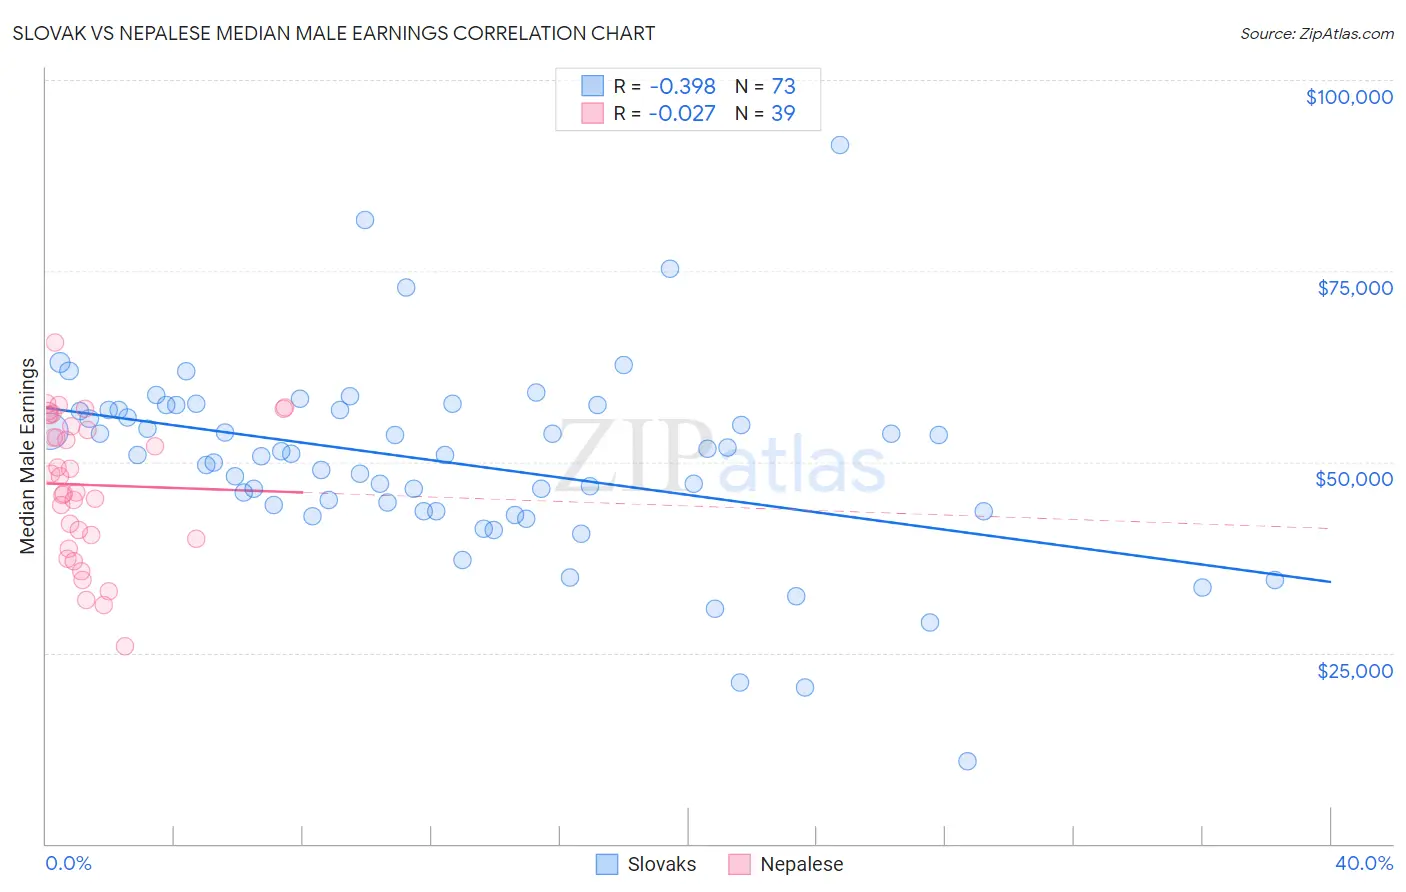
Slovak vs Nepalese Median Male Earnings Correlation Chart
The statistical analysis conducted on geographies consisting of 397,698,254 people shows a mild negative correlation between the proportion of Slovaks and median male earnings in the United States with a correlation coefficient (R) of -0.398 and weighted average of $56,306. Similarly, the statistical analysis conducted on geographies consisting of 24,431,712 people shows no correlation between the proportion of Nepalese and median male earnings in the United States with a correlation coefficient (R) of -0.027 and weighted average of $49,458, a difference of 13.9%.
Median Male Earnings Correlation Summary
| Measurement | Slovak | Nepalese |
| Minimum | $10,727 | $25,893 |
| Maximum | $91,563 | $65,607 |
| Range | $80,836 | $39,714 |
| Mean | $49,965 | $46,984 |
| Median | $50,933 | $48,060 |
| Interquartile 25% (IQ1) | $43,560 | $40,000 |
| Interquartile 75% (IQ3) | $56,815 | $56,086 |
| Interquartile Range (IQR) | $13,254 | $16,086 |
| Standard Deviation (Sample) | $12,608 | $9,323 |
| Standard Deviation (Population) | $12,522 | $9,202 |
Similar Demographics by Median Male Earnings
Demographics Similar to Slovaks by Median Male Earnings
In terms of median male earnings, the demographic groups most similar to Slovaks are Zimbabwean ($56,302, a difference of 0.010%), Luxembourger ($56,300, a difference of 0.010%), Danish ($56,246, a difference of 0.11%), Ethiopian ($56,243, a difference of 0.11%), and Slavic ($56,390, a difference of 0.15%).
| Demographics | Rating | Rank | Median Male Earnings |
| Portuguese | 89.4 /100 | #131 | Excellent $56,663 |
| Czechs | 88.2 /100 | #132 | Excellent $56,546 |
| Immigrants | Germany | 88.2 /100 | #133 | Excellent $56,542 |
| Moroccans | 87.7 /100 | #134 | Excellent $56,499 |
| Irish | 87.4 /100 | #135 | Excellent $56,464 |
| Immigrants | Saudi Arabia | 87.2 /100 | #136 | Excellent $56,452 |
| Slavs | 86.5 /100 | #137 | Excellent $56,390 |
| Slovaks | 85.5 /100 | #138 | Excellent $56,306 |
| Zimbabweans | 85.5 /100 | #139 | Excellent $56,302 |
| Luxembourgers | 85.5 /100 | #140 | Excellent $56,300 |
| Danes | 84.8 /100 | #141 | Excellent $56,246 |
| Ethiopians | 84.8 /100 | #142 | Excellent $56,243 |
| Sri Lankans | 83.4 /100 | #143 | Excellent $56,136 |
| Immigrants | Uganda | 82.4 /100 | #144 | Excellent $56,064 |
| Norwegians | 80.9 /100 | #145 | Excellent $55,965 |
Demographics Similar to Nepalese by Median Male Earnings
In terms of median male earnings, the demographic groups most similar to Nepalese are Cree ($49,497, a difference of 0.080%), Iroquois ($49,374, a difference of 0.17%), Liberian ($49,318, a difference of 0.28%), British West Indian ($49,636, a difference of 0.36%), and Immigrants from West Indies ($49,271, a difference of 0.38%).
| Demographics | Rating | Rank | Median Male Earnings |
| Immigrants | Cabo Verde | 1.2 /100 | #252 | Tragic $50,009 |
| German Russians | 1.1 /100 | #253 | Tragic $49,924 |
| Senegalese | 1.0 /100 | #254 | Tragic $49,774 |
| Alaskan Athabascans | 0.9 /100 | #255 | Tragic $49,748 |
| Alaska Natives | 0.9 /100 | #256 | Tragic $49,711 |
| British West Indians | 0.8 /100 | #257 | Tragic $49,636 |
| Cree | 0.7 /100 | #258 | Tragic $49,497 |
| Nepalese | 0.7 /100 | #259 | Tragic $49,458 |
| Iroquois | 0.7 /100 | #260 | Tragic $49,374 |
| Liberians | 0.6 /100 | #261 | Tragic $49,318 |
| Immigrants | West Indies | 0.6 /100 | #262 | Tragic $49,271 |
| Nicaraguans | 0.6 /100 | #263 | Tragic $49,215 |
| Immigrants | Middle Africa | 0.6 /100 | #264 | Tragic $49,201 |
| Immigrants | Laos | 0.6 /100 | #265 | Tragic $49,190 |
| Somalis | 0.5 /100 | #266 | Tragic $49,025 |