Immigrants from Latvia vs Nepalese Female Disability
COMPARE
Immigrants from Latvia
Nepalese
Female Disability
Female Disability Comparison
Immigrants from Latvia
Nepalese
11.8%
FEMALE DISABILITY
95.6/ 100
METRIC RATING
128th/ 347
METRIC RANK
13.3%
FEMALE DISABILITY
0.0/ 100
METRIC RATING
296th/ 347
METRIC RANK
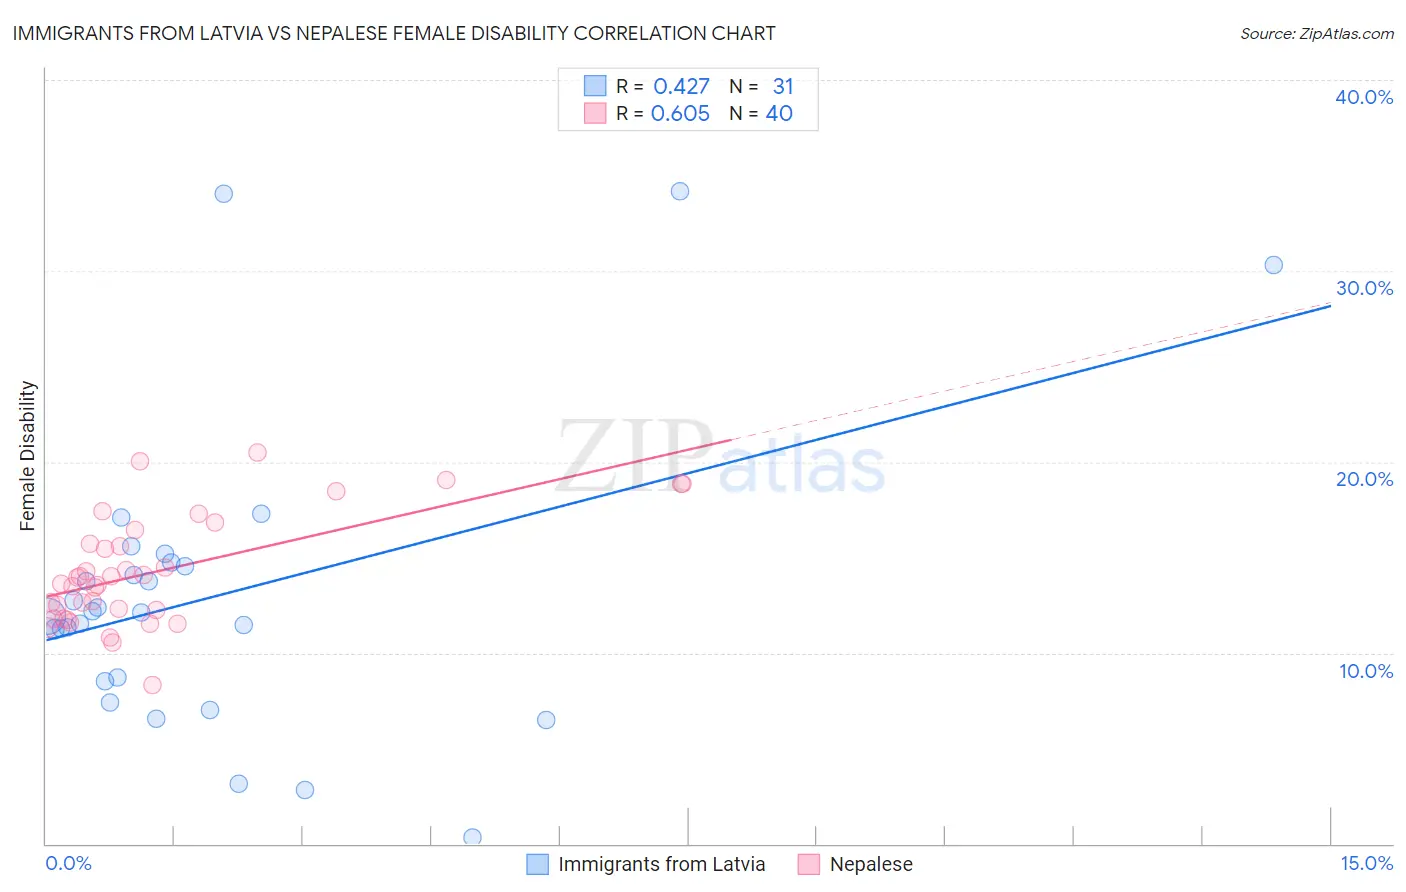
Immigrants from Latvia vs Nepalese Female Disability Correlation Chart
The statistical analysis conducted on geographies consisting of 113,739,259 people shows a moderate positive correlation between the proportion of Immigrants from Latvia and percentage of females with a disability in the United States with a correlation coefficient (R) of 0.427 and weighted average of 11.8%. Similarly, the statistical analysis conducted on geographies consisting of 24,521,755 people shows a significant positive correlation between the proportion of Nepalese and percentage of females with a disability in the United States with a correlation coefficient (R) of 0.605 and weighted average of 13.3%, a difference of 12.5%.
Female Disability Correlation Summary
| Measurement | Immigrants from Latvia | Nepalese |
| Minimum | 0.34% | 8.3% |
| Maximum | 34.2% | 20.5% |
| Range | 33.8% | 12.2% |
| Mean | 13.0% | 14.2% |
| Median | 12.1% | 13.8% |
| Interquartile 25% (IQ1) | 8.5% | 12.0% |
| Interquartile 75% (IQ3) | 14.7% | 16.1% |
| Interquartile Range (IQR) | 6.2% | 4.1% |
| Standard Deviation (Sample) | 7.8% | 2.9% |
| Standard Deviation (Population) | 7.6% | 2.8% |
Similar Demographics by Female Disability
Demographics Similar to Immigrants from Latvia by Female Disability
In terms of female disability, the demographic groups most similar to Immigrants from Latvia are Macedonian (11.8%, a difference of 0.030%), South American Indian (11.8%, a difference of 0.040%), Nicaraguan (11.9%, a difference of 0.090%), Arab (11.9%, a difference of 0.12%), and Immigrants from Europe (11.8%, a difference of 0.14%).
| Demographics | Rating | Rank | Female Disability |
| Immigrants | Netherlands | 96.9 /100 | #121 | Exceptional 11.8% |
| Immigrants | North Macedonia | 96.8 /100 | #122 | Exceptional 11.8% |
| Immigrants | Croatia | 96.7 /100 | #123 | Exceptional 11.8% |
| Russians | 96.5 /100 | #124 | Exceptional 11.8% |
| Immigrants | Italy | 96.4 /100 | #125 | Exceptional 11.8% |
| Immigrants | Europe | 96.2 /100 | #126 | Exceptional 11.8% |
| South American Indians | 95.8 /100 | #127 | Exceptional 11.8% |
| Immigrants | Latvia | 95.6 /100 | #128 | Exceptional 11.8% |
| Macedonians | 95.5 /100 | #129 | Exceptional 11.8% |
| Nicaraguans | 95.2 /100 | #130 | Exceptional 11.9% |
| Arabs | 95.1 /100 | #131 | Exceptional 11.9% |
| Immigrants | Syria | 94.6 /100 | #132 | Exceptional 11.9% |
| Kenyans | 94.5 /100 | #133 | Exceptional 11.9% |
| Immigrants | Nicaragua | 94.5 /100 | #134 | Exceptional 11.9% |
| Central Americans | 94.2 /100 | #135 | Exceptional 11.9% |
Demographics Similar to Nepalese by Female Disability
In terms of female disability, the demographic groups most similar to Nepalese are Slovak (13.3%, a difference of 0.030%), French (13.3%, a difference of 0.14%), Celtic (13.3%, a difference of 0.34%), Nonimmigrants (13.4%, a difference of 0.34%), and Marshallese (13.3%, a difference of 0.39%).
| Demographics | Rating | Rank | Female Disability |
| Tlingit-Haida | 0.0 /100 | #289 | Tragic 13.2% |
| Immigrants | Yemen | 0.0 /100 | #290 | Tragic 13.2% |
| Shoshone | 0.0 /100 | #291 | Tragic 13.2% |
| Yakama | 0.0 /100 | #292 | Tragic 13.2% |
| Marshallese | 0.0 /100 | #293 | Tragic 13.3% |
| Celtics | 0.0 /100 | #294 | Tragic 13.3% |
| French | 0.0 /100 | #295 | Tragic 13.3% |
| Nepalese | 0.0 /100 | #296 | Tragic 13.3% |
| Slovaks | 0.0 /100 | #297 | Tragic 13.3% |
| Immigrants | Nonimmigrants | 0.0 /100 | #298 | Tragic 13.4% |
| Immigrants | Dominican Republic | 0.0 /100 | #299 | Tragic 13.4% |
| Pennsylvania Germans | 0.0 /100 | #300 | Tragic 13.4% |
| Africans | 0.0 /100 | #301 | Tragic 13.4% |
| Scotch-Irish | 0.0 /100 | #302 | Tragic 13.4% |
| Immigrants | Portugal | 0.0 /100 | #303 | Tragic 13.5% |