Immigrants from Egypt vs Indonesian Female Disability
COMPARE
Immigrants from Egypt
Indonesian
Female Disability
Female Disability Comparison
Immigrants from Egypt
Indonesians
11.1%
FEMALE DISABILITY
100.0/ 100
METRIC RATING
33rd/ 347
METRIC RANK
12.8%
FEMALE DISABILITY
0.4/ 100
METRIC RATING
269th/ 347
METRIC RANK
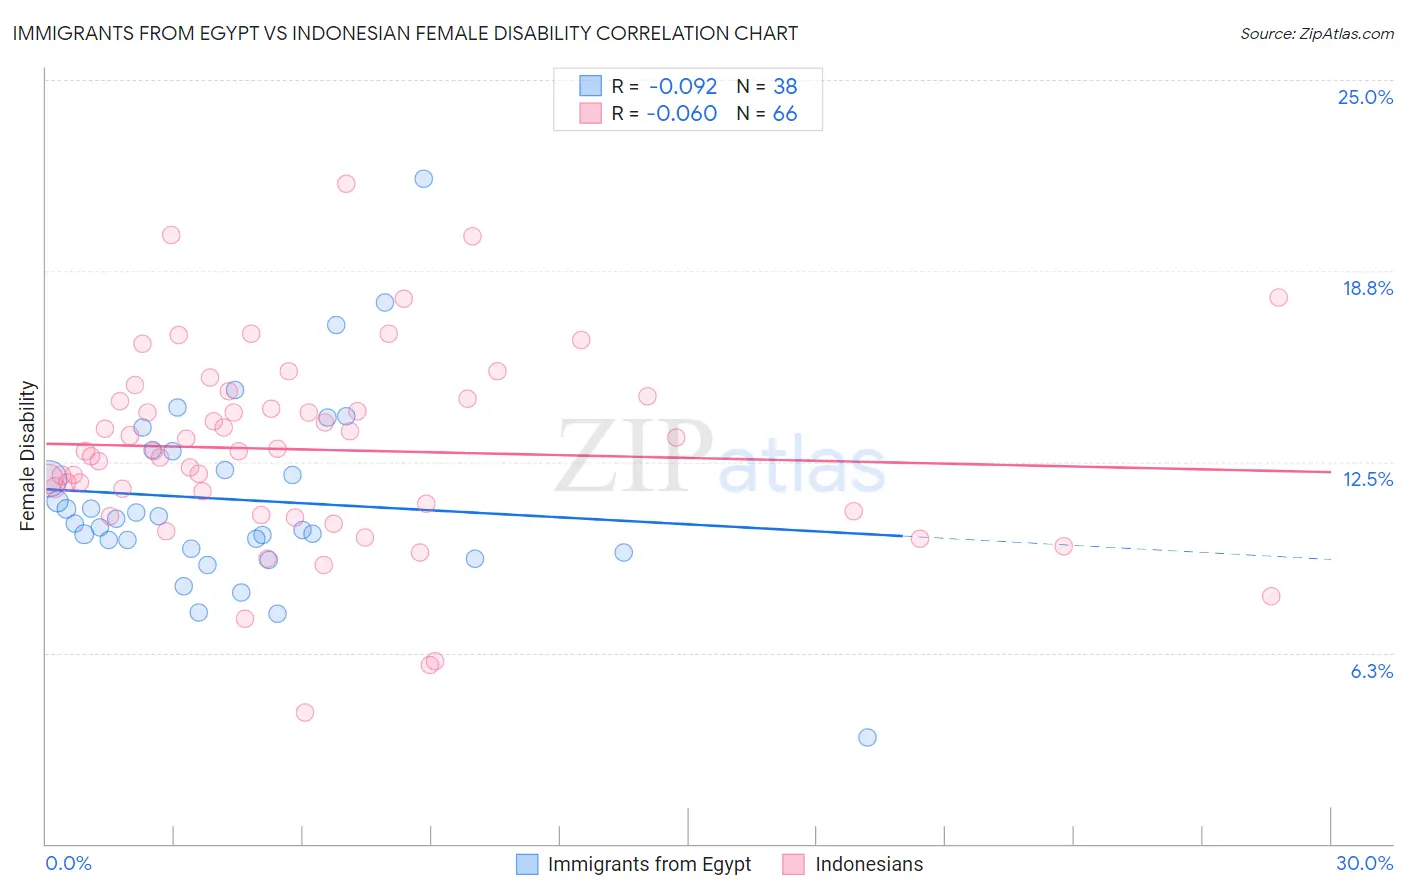
Immigrants from Egypt vs Indonesian Female Disability Correlation Chart
The statistical analysis conducted on geographies consisting of 245,491,192 people shows a slight negative correlation between the proportion of Immigrants from Egypt and percentage of females with a disability in the United States with a correlation coefficient (R) of -0.092 and weighted average of 11.1%. Similarly, the statistical analysis conducted on geographies consisting of 162,725,263 people shows a slight negative correlation between the proportion of Indonesians and percentage of females with a disability in the United States with a correlation coefficient (R) of -0.060 and weighted average of 12.8%, a difference of 15.2%.
Female Disability Correlation Summary
| Measurement | Immigrants from Egypt | Indonesian |
| Minimum | 3.5% | 4.3% |
| Maximum | 21.8% | 21.6% |
| Range | 18.3% | 17.3% |
| Mean | 11.3% | 12.9% |
| Median | 10.6% | 12.9% |
| Interquartile 25% (IQ1) | 9.7% | 10.9% |
| Interquartile 75% (IQ3) | 12.8% | 14.6% |
| Interquartile Range (IQR) | 3.2% | 3.7% |
| Standard Deviation (Sample) | 3.2% | 3.2% |
| Standard Deviation (Population) | 3.1% | 3.2% |
Similar Demographics by Female Disability
Demographics Similar to Immigrants from Egypt by Female Disability
In terms of female disability, the demographic groups most similar to Immigrants from Egypt are Immigrants from Australia (11.1%, a difference of 0.080%), Immigrants from Kuwait (11.1%, a difference of 0.25%), Immigrants from Indonesia (11.2%, a difference of 0.25%), Immigrants from Malaysia (11.1%, a difference of 0.35%), and Turkish (11.1%, a difference of 0.35%).
| Demographics | Rating | Rank | Female Disability |
| Argentineans | 100.0 /100 | #26 | Exceptional 11.0% |
| Immigrants | Turkey | 100.0 /100 | #27 | Exceptional 11.1% |
| Egyptians | 100.0 /100 | #28 | Exceptional 11.1% |
| Immigrants | Malaysia | 100.0 /100 | #29 | Exceptional 11.1% |
| Turks | 100.0 /100 | #30 | Exceptional 11.1% |
| Immigrants | Kuwait | 100.0 /100 | #31 | Exceptional 11.1% |
| Immigrants | Australia | 100.0 /100 | #32 | Exceptional 11.1% |
| Immigrants | Egypt | 100.0 /100 | #33 | Exceptional 11.1% |
| Immigrants | Indonesia | 100.0 /100 | #34 | Exceptional 11.2% |
| Immigrants | Japan | 100.0 /100 | #35 | Exceptional 11.2% |
| Cypriots | 100.0 /100 | #36 | Exceptional 11.2% |
| Ethiopians | 100.0 /100 | #37 | Exceptional 11.2% |
| Immigrants | Ethiopia | 100.0 /100 | #38 | Exceptional 11.2% |
| Immigrants | Lithuania | 100.0 /100 | #39 | Exceptional 11.2% |
| Mongolians | 100.0 /100 | #40 | Exceptional 11.2% |
Demographics Similar to Indonesians by Female Disability
In terms of female disability, the demographic groups most similar to Indonesians are Immigrants from Laos (12.8%, a difference of 0.060%), Senegalese (12.8%, a difference of 0.090%), Finnish (12.8%, a difference of 0.10%), Immigrants from Liberia (12.9%, a difference of 0.18%), and West Indian (12.8%, a difference of 0.22%).
| Demographics | Rating | Rank | Female Disability |
| Czechoslovakians | 0.9 /100 | #262 | Tragic 12.7% |
| Spaniards | 0.7 /100 | #263 | Tragic 12.8% |
| Alaska Natives | 0.6 /100 | #264 | Tragic 12.8% |
| West Indians | 0.5 /100 | #265 | Tragic 12.8% |
| Finns | 0.4 /100 | #266 | Tragic 12.8% |
| Senegalese | 0.4 /100 | #267 | Tragic 12.8% |
| Immigrants | Laos | 0.4 /100 | #268 | Tragic 12.8% |
| Indonesians | 0.4 /100 | #269 | Tragic 12.8% |
| Immigrants | Liberia | 0.3 /100 | #270 | Tragic 12.9% |
| Dutch | 0.2 /100 | #271 | Tragic 12.9% |
| Germans | 0.1 /100 | #272 | Tragic 12.9% |
| Sioux | 0.1 /100 | #273 | Tragic 12.9% |
| Portuguese | 0.1 /100 | #274 | Tragic 13.0% |
| Cheyenne | 0.1 /100 | #275 | Tragic 13.0% |
| Immigrants | Dominica | 0.1 /100 | #276 | Tragic 13.0% |