Slovak vs Immigrants from North America Doctorate Degree
COMPARE
Slovak
Immigrants from North America
Doctorate Degree
Doctorate Degree Comparison
Slovaks
Immigrants from North America
1.8%
DOCTORATE DEGREE
36.4/ 100
METRIC RATING
185th/ 347
METRIC RANK
2.2%
DOCTORATE DEGREE
99.8/ 100
METRIC RATING
74th/ 347
METRIC RANK
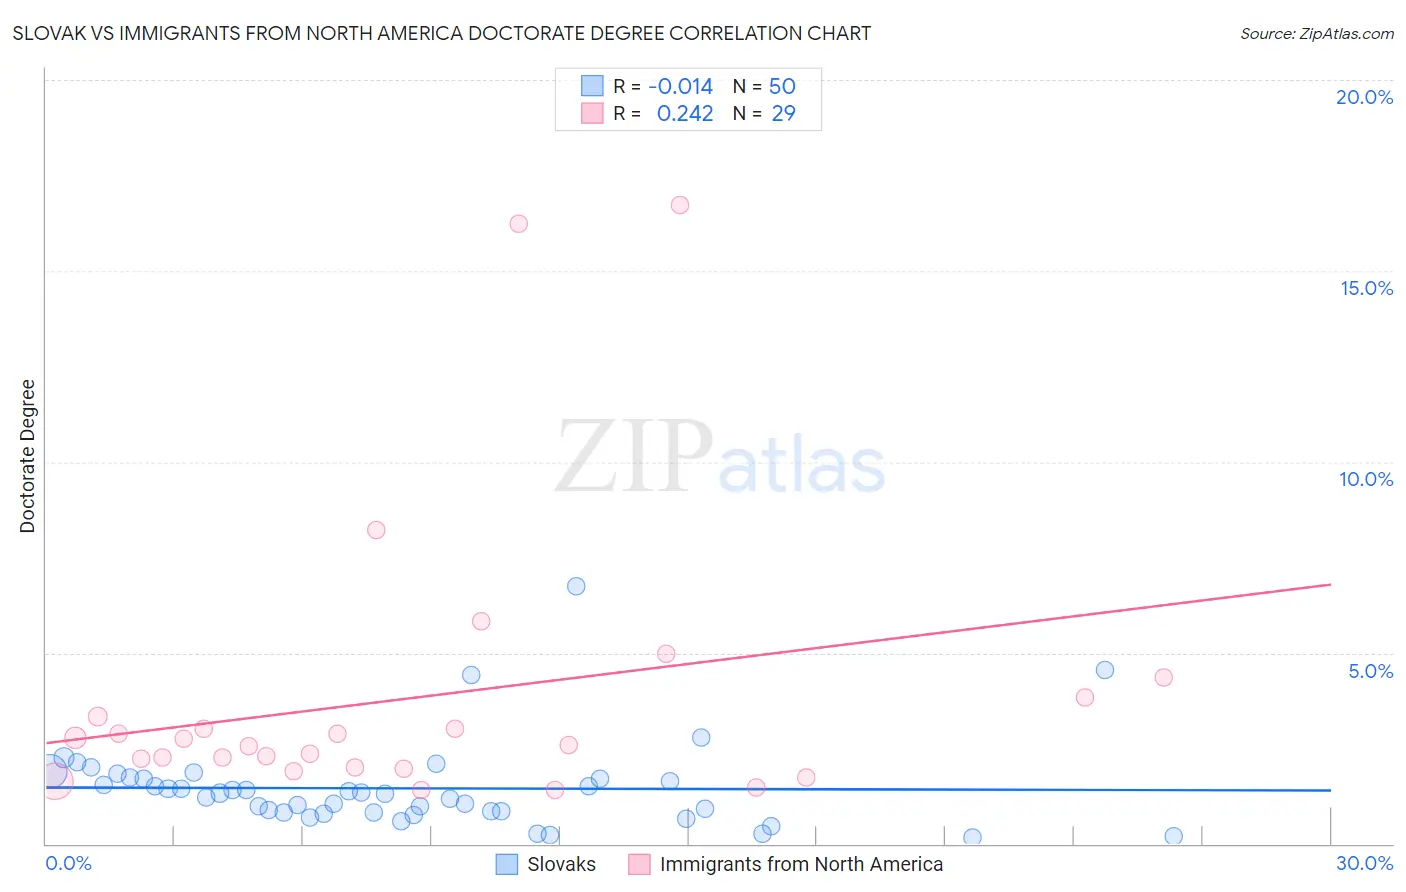
Slovak vs Immigrants from North America Doctorate Degree Correlation Chart
The statistical analysis conducted on geographies consisting of 392,855,228 people shows no correlation between the proportion of Slovaks and percentage of population with at least doctorate degree education in the United States with a correlation coefficient (R) of -0.014 and weighted average of 1.8%. Similarly, the statistical analysis conducted on geographies consisting of 455,963,047 people shows a weak positive correlation between the proportion of Immigrants from North America and percentage of population with at least doctorate degree education in the United States with a correlation coefficient (R) of 0.242 and weighted average of 2.2%, a difference of 24.9%.
Doctorate Degree Correlation Summary
| Measurement | Slovak | Immigrants from North America |
| Minimum | 0.17% | 1.4% |
| Maximum | 6.8% | 16.7% |
| Range | 6.6% | 15.3% |
| Mean | 1.5% | 3.8% |
| Median | 1.3% | 2.6% |
| Interquartile 25% (IQ1) | 0.83% | 2.0% |
| Interquartile 75% (IQ3) | 1.7% | 3.6% |
| Interquartile Range (IQR) | 0.88% | 1.6% |
| Standard Deviation (Sample) | 1.2% | 3.8% |
| Standard Deviation (Population) | 1.1% | 3.7% |
Similar Demographics by Doctorate Degree
Demographics Similar to Slovaks by Doctorate Degree
In terms of doctorate degree, the demographic groups most similar to Slovaks are Peruvian (1.8%, a difference of 0.32%), Czechoslovakian (1.8%, a difference of 0.55%), Nigerian (1.8%, a difference of 0.57%), Finnish (1.8%, a difference of 0.90%), and German (1.8%, a difference of 1.0%).
| Demographics | Rating | Rank | Doctorate Degree |
| French | 48.8 /100 | #178 | Average 1.8% |
| Ghanaians | 48.3 /100 | #179 | Average 1.8% |
| Scandinavians | 48.0 /100 | #180 | Average 1.8% |
| Immigrants | Immigrants | 46.2 /100 | #181 | Average 1.8% |
| Immigrants | Afghanistan | 44.3 /100 | #182 | Average 1.8% |
| Finns | 42.1 /100 | #183 | Average 1.8% |
| Nigerians | 39.9 /100 | #184 | Fair 1.8% |
| Slovaks | 36.4 /100 | #185 | Fair 1.8% |
| Peruvians | 34.4 /100 | #186 | Fair 1.8% |
| Czechoslovakians | 33.0 /100 | #187 | Fair 1.8% |
| Germans | 30.5 /100 | #188 | Fair 1.8% |
| French Canadians | 30.2 /100 | #189 | Fair 1.8% |
| Immigrants | Costa Rica | 30.2 /100 | #190 | Fair 1.8% |
| South Americans | 29.5 /100 | #191 | Fair 1.8% |
| Dutch | 27.4 /100 | #192 | Fair 1.8% |
Demographics Similar to Immigrants from North America by Doctorate Degree
In terms of doctorate degree, the demographic groups most similar to Immigrants from North America are Immigrants from Western Asia (2.2%, a difference of 0.10%), Immigrants from Bulgaria (2.3%, a difference of 0.14%), Immigrants from Hungary (2.2%, a difference of 0.18%), Immigrants from Lebanon (2.2%, a difference of 0.18%), and Immigrants from Canada (2.3%, a difference of 0.22%).
| Demographics | Rating | Rank | Doctorate Degree |
| Zimbabweans | 99.8 /100 | #67 | Exceptional 2.3% |
| Immigrants | Kazakhstan | 99.8 /100 | #68 | Exceptional 2.3% |
| Carpatho Rusyns | 99.8 /100 | #69 | Exceptional 2.3% |
| Lithuanians | 99.8 /100 | #70 | Exceptional 2.3% |
| Immigrants | Bolivia | 99.8 /100 | #71 | Exceptional 2.3% |
| Immigrants | Canada | 99.8 /100 | #72 | Exceptional 2.3% |
| Immigrants | Bulgaria | 99.8 /100 | #73 | Exceptional 2.3% |
| Immigrants | North America | 99.8 /100 | #74 | Exceptional 2.2% |
| Immigrants | Western Asia | 99.8 /100 | #75 | Exceptional 2.2% |
| Immigrants | Hungary | 99.8 /100 | #76 | Exceptional 2.2% |
| Immigrants | Lebanon | 99.8 /100 | #77 | Exceptional 2.2% |
| Immigrants | Belarus | 99.7 /100 | #78 | Exceptional 2.2% |
| Northern Europeans | 99.7 /100 | #79 | Exceptional 2.2% |
| Ugandans | 99.7 /100 | #80 | Exceptional 2.2% |
| Immigrants | Argentina | 99.7 /100 | #81 | Exceptional 2.2% |